. 2000 Jan;74(1):456-64.
doi: 10.1128/jvi.74.1.456-464.2000.

Secondary structure analysis of a minimal avian leukosis-sarcoma virus packaging signal

Affiliations

Secondary structure analysis of a minimal avian leukosis-sarcoma virus packaging signal

J D Banks et al. J Virol. 2000 Jan.

Abstract

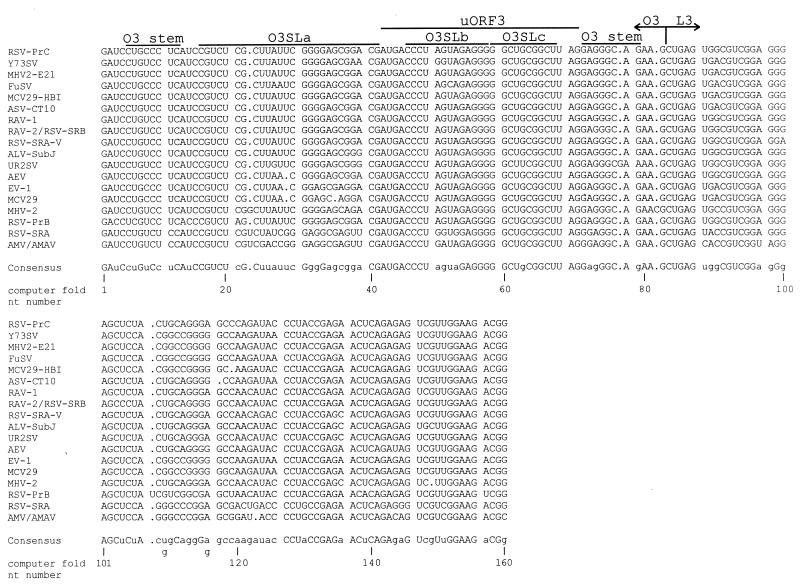
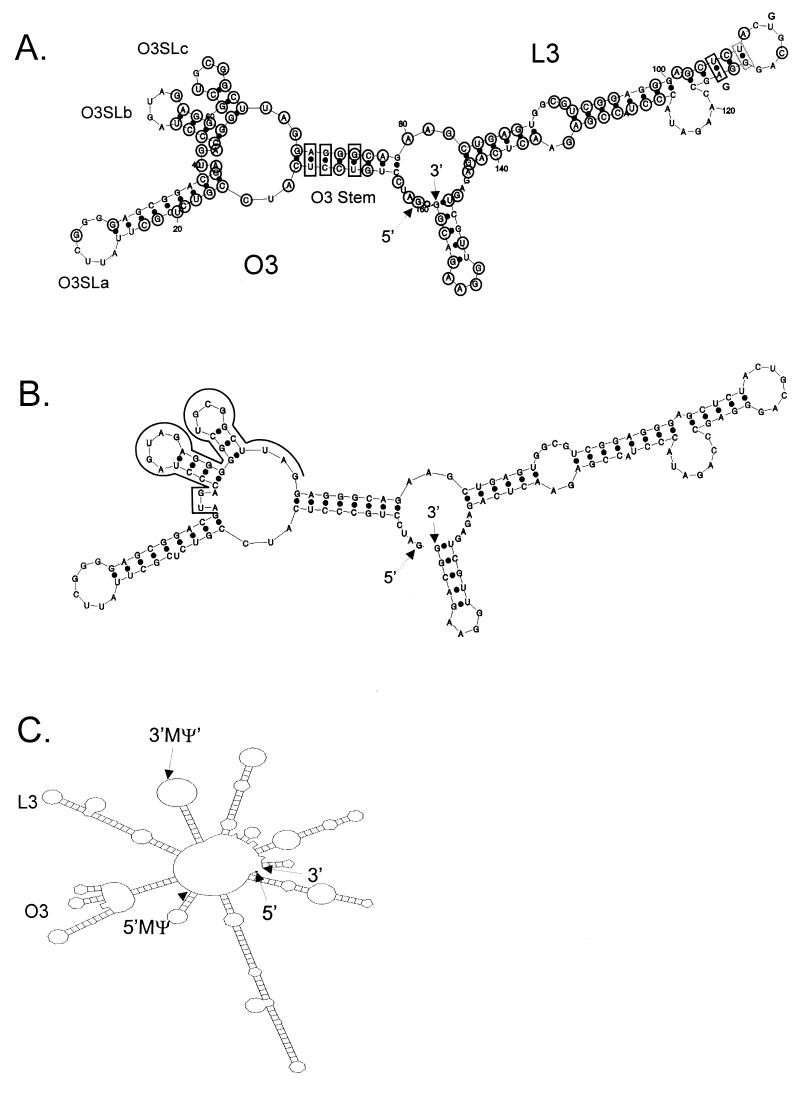
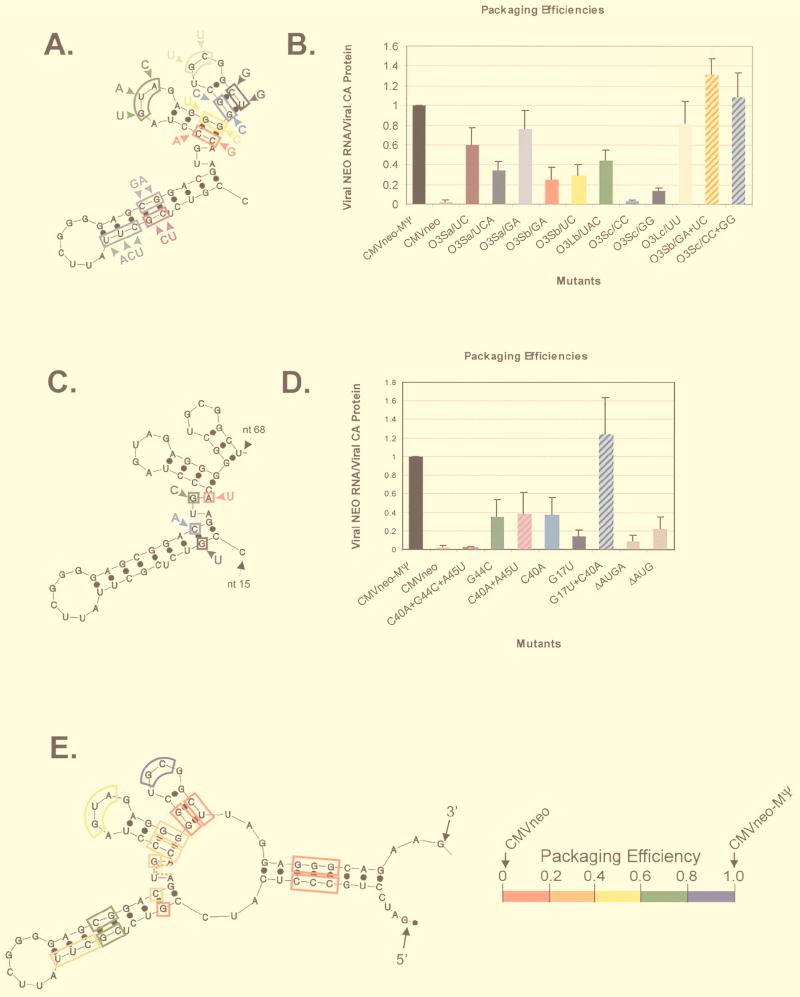
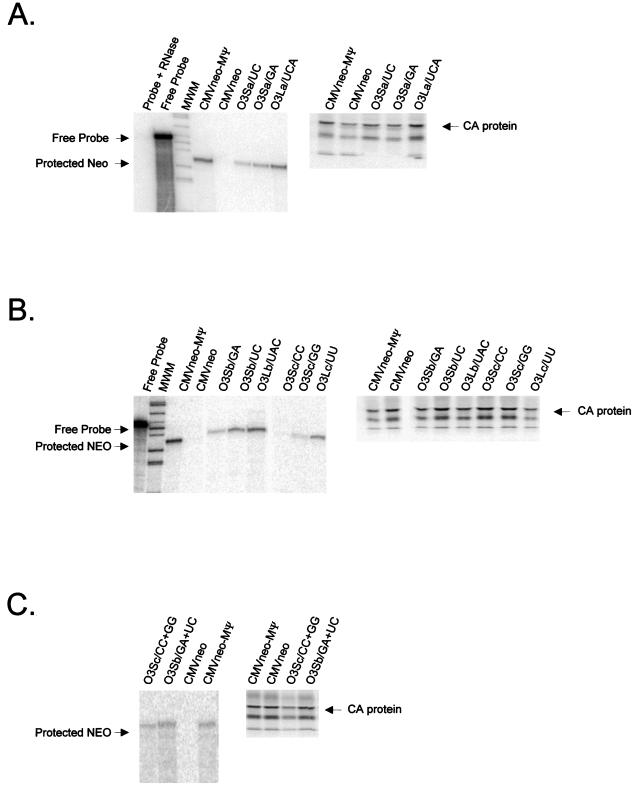
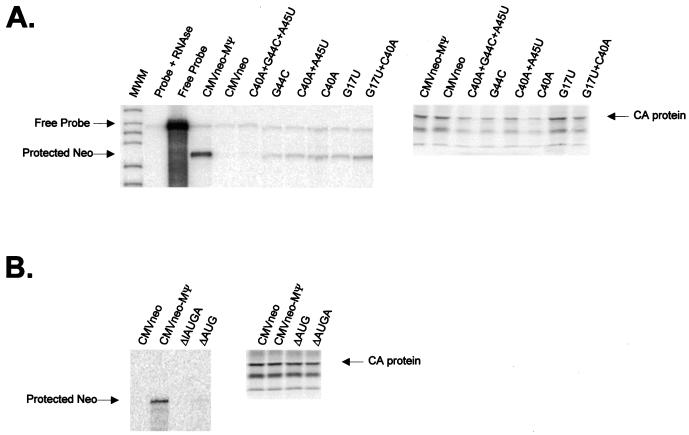
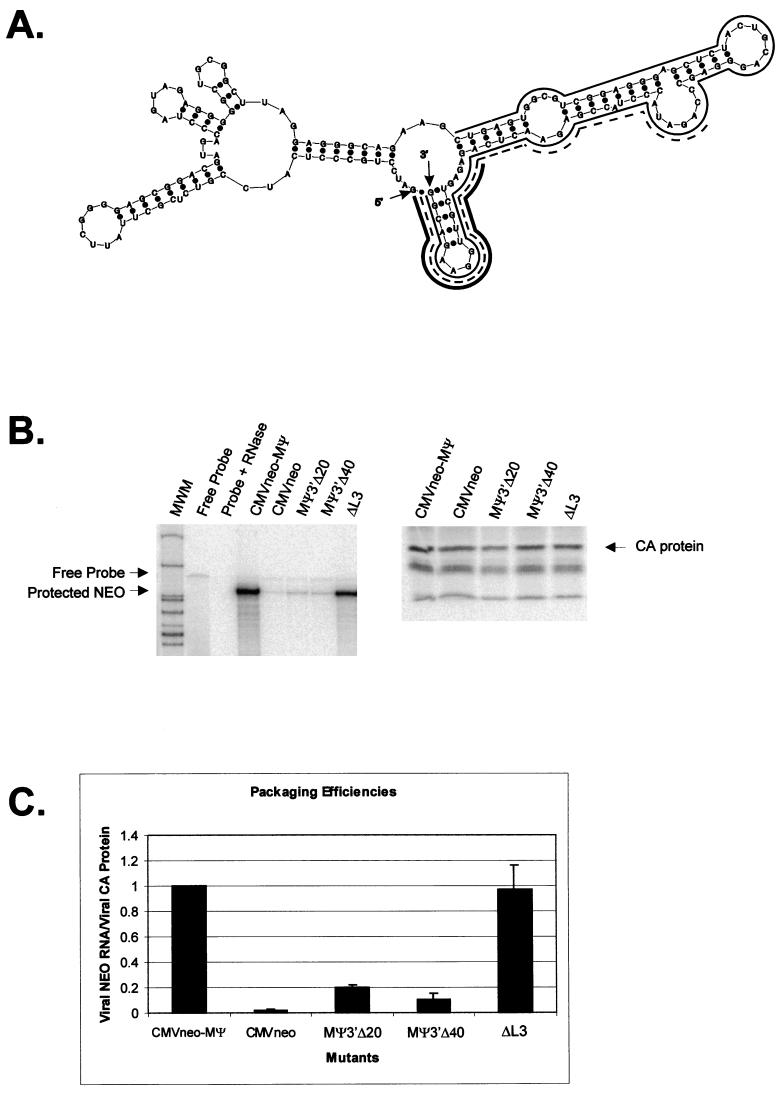
We previously identified a 160-nucleotide packaging signal, MPsi, from the 5' end of the Rous sarcoma virus genome. In this study, we determine the secondary structure of MPsi by using phylogenetic analysis with computer modeling and heterologous packaging assays of point mutants. The results of the in vivo studies are in good agreement with the computer model. Additionally, the packaging studies indicate several structures which are important for efficient packaging, including a single-stranded bulge containing the initiation codon for the short open reading frame, uORF3, as well as adjacent stem structures. Finally, we show that the L3 stem-loop at the 3' end of MPsi is dispensable for packaging, thus identifying an 82-nucleotide minimal packaging signal, microPsi, composed of the O3 stem-loop.


Figures

FIG. 1
FIG. 1
Computer alignment of the MΨ sequence from 20 ALSV strains. Strains with identical MΨ sequence are shown on the same line. The sequences corresponding to uORF3 and the computer-predicted O3 and L3 stem-loops are outlined. Gaps in the alignment of the sequences are indicated by periods. The consensus sequence is shown below the alignment. Nucleotides conserved in all 20 strains are indicated by capital letters in the consensus. In cases where two nucleotides are equally conserved at a given position, both are indicated.
FIG. 2
FIG. 2
(A) mfold (23, 25) computer model of the most stable secondary structure of the MΨ consensus sequence (free energy, −56.2 kcal/mol). The 5′ and 3′ ends of the RNA are indicated. The two major stem-loop structures, O3 and L3, are indicated, as well as the smaller stem-loops extending from the O3 loop: O3SLa, O3SLb, and O3SLc. Nucleotides conserved in all 20 strains are circled. Black boxes indicate positions in which the precise nucleotides are not conserved but the predicted base pairing is conserved in all 20 strains. The gray box indicates a position in which the predicted base pairing is conserved in 19 of the 20 strains. (B) Computer model of the most stable secondary structure of the MΨ sequence of RSV-PrC (−59.0 kcal/mol). The 5′ and 3′ ends of the RNA are indicated, and the uORF3 sequence is outlined. (C) Computer model of the most stable secondary structure of the first 451 nt of the RSV-PrC genomic RNA (−159.6 kcal/mol). The 5′ and 3′ ends of the RNA are indicated, and the 5′ and 3′ ends of the sequence corresponding to MΨ are also shown.
FIG. 3
FIG. 3
(A) Summary of site-directed mutagenesis of O3SLa, O3SLb, and O3SLc. Each colored box represents a different mutant. The new sequence is indicated outside the box. (B) Average packaging efficiencies of the mutants shown in panel A from three repetitions of the packaging assay, relative to CMVneo-MΨ. Bar chart colors correspond to the mutant colors in panel A. Striped bars represent compensatory mutants. Error bars represent standard deviations. Packaging efficiencies were calculated as the ratio of neo RNA packaged into particles, as measured by RPA, to the number of viral particles, as measured by RIPA. (C) Summary of site-directed mutagenesis of the uORF3 initiation codon and surrounding nucleotides. (D) Packaging efficiencies of the mutants shown in panel C. (E) Computer fold of μΨ, the first 82 nt of MΨ, summarizing the site-directed mutagenesis studies. Each box represents a different mutant. The dashed line indicates a deletion mutant. The colors correspond to the packaging efficiency of that mutant, as shown at the right of the fold. The 5′ and 3′ ends of the RNA are indicated.
FIG. 4
FIG. 4
(A) RPA (left) and RIPA (right) of virions released from G418-resistant mass cultures of Q2bn cells transfected with plasmids expressing the O3SLa mutant RNAs (described in Fig. 3A) indicated above each lane. In the RPA, RNAs were protected with an antisense neo probe. The expected location of free probe and the protected neo bands are indicated. For the RIPA, proteins were precipitated with anti-PRB antibody. The expected size of the capsid (CA) band is indicated. (B) RPA (left) and RIPA (right) of virions released from cells transfected with plasmids expressing the O3SLb and O3SLc mutant RNAs (described in Fig. 3A) indicated above each lane. (C) RPA (left) and RIPA (right) of virions released from cells transfected with plasmids expressing the O3Sb and O3Sc compensatory mutation RNAs.
FIG. 5
FIG. 5
(A) RPA (left) and RIPA (right) of virions released from G418-resistant mass cultures of Q2bn cells transfected with plasmids expressing the uORF3 mutant RNAs (described in Fig. 3C) indicated above each lane. In the RPA, RNAs were protected with an antisense neo probe. The expected locations of free probe and the protected neo bands are indicated. For the RIPA, proteins were precipitated with anti-PRB antibody. The expected size of the capsid (CA) band is indicated. (B) RPA (left) and RIPA (right) of virions released from cells transfected with plasmids expressing the uORF3 initiation codon deletion mutant RNAs.
FIG. 6
FIG. 6
(A) Computer fold of MΨ, with lines shown next to nucleotides deleted in L3 mutants. The thin solid line indicates nucleotides deleted in ΔL3. The dashed line indicates nucleotides deleted in MΨ3′Δ40. The thick solid line indicates nucleotides deleted in MΨ3′Δ20. The 5′ and 3′ ends of the RNA are indicated. (B) RPA (left) and RIPA (right) of virions released from G418-resistant mass cultures of Q2bn cells transfected with plasmids expressing the L3 mutant RNAs indicated above each lane. In the RPA, RNAs were protected with an antisense neo probe. The expected locations of the free probe and the protected neo bands are indicated. For the RIPA, proteins were precipitated with anti-PRB antibody. The expected size of the capsid (CA) band is indicated. (C) Average packaging efficiencies of the mutants, from three repetitions of the packaging assay, relative to CMVneo-MΨ. Error bars represent standard deviations. Packaging efficiencies were calculated as the ratio of neo RNA packaged into particles, as measured by RPA, to the number of viral particles, as measured by RIPA.

Similar articles

Cited by

References

    1. Aronoff R, Linial M L. Specificity of retroviral RNA packaging. J Virol. 1991;65:71–80. - PMC - PubMed
    1. Banks J D, Beemon K L, Linial M L. RNA regulatory elements in the genomes of simple retroviruses. Semin Virol. 1997;8:194–204.
    1. Banks J D, Kealoha B O, Linial M L. An MΨ-containing heterologous RNA, but not env mRNA, is efficiently packaged into avian retroviral particles. J Virol. 1999;73:8926–8933. - PMC - PubMed
    1. Banks J D, Yeo A, Green K, Cepeda F, Linial M L. A minimal avian retroviral packaging sequence has a complex structure. J Virol. 1998;72:6190–6194. - PMC - PubMed
    1. Berkowitz R, Fisher J, Goff S P. RNA packaging. Curr Top Microbiol Immunol. 1996;214:177–218. - PubMed

Publication types

LinkOut - more resources