

doi: 10.1126/science.286.5447.2176.
Mouse tumor model for neurofibromatosis type 1
Affiliations
- PMID: 10591653
- PMCID: PMC3079436
- DOI: 10.1126/science.286.5447.2176
Item in Clipboard
Mouse tumor model for neurofibromatosis type 1
Science.
.
Abstract
Neurofibromatosis type 1 (NF1) is an autosomal dominant disorder characterized by increased incidence of benign and malignant tumors of neural crest origin. Mutations that activate the protooncogene ras, such as loss of Nf1, cooperate with inactivating mutations at the p53 tumor suppressor gene during malignant transformation. One hundred percent of mice harboring null Nf1 and p53 alleles in cis synergize to develop soft tissue sarcomas between 3 and 7 months of age. These sarcomas exhibit loss of heterozygosity at both gene loci and express phenotypic traits characteristic of neural crest derivatives and human NF1 malignancies.
Figures

(A) Mice were maintained in specific pathogen-free conditions and observed daily for evidence of illness or tumor formation. If palpable tumors exceeded 1 cm in diameter or interfered with feeding and grooming, mice were sacrificed. Moribund mice with possible internal tumors were also sacrificed. Purple, Nf1+/−:p53−/−; green, cis-Nf1+/−:p53+/− (17); black, p53−/−; blue, trans-Nf1+/−:p53+/−; red, p53+/−. (B) PCR assay for wild-type (WT) and mutant (Mut) alleles of the Nf1 and p53 genes (8, 11). Alternating lanes show normal and tumor tissue from five different mice. Tumors 1, 2, and 3 are cis-Nf1:p53 sarcomas. Tumors 1 and 2 show LOH at both loci, whereas tumor 3 shows LOH at p53 and reduced WT Nf1. Tumor 4 is an Nf1+/−:p53−/− lymphoma, and the mutant p53 allele is present in normal and tumor tissues. No LOH was observed at the Nf1 locus. Tumor 5 is a cis-Nf1:p53 tumor that did not show LOH at either locus. (C) Tumor histopathology and immunohistochemistry. (A) MTT. Rhabdomyoblastic cells stained with hematoxylin and eosin (H & E) (arrow) with abundant eosinophilic cytoplasm (×20). (B) Strong immunostaining of these cells with myoglobin (×40). (C) MPNST. H & E staining showing areas of typical intersecting fascicles of spindle-shaped cells (arrows) (×20). (D) Lower magnification (×5) shows intense S100 nuclear protein immunostaining of cells that surround branching vascular spaces. (E) Leiomyosarcoma (LMS) composed of intersecting horizontal and vertical (arrows) fascicles of spindle cells (×5). (F) Robust α-actin (SMA) immunostaining of LMS (×10). (G) Rhabdomyosarcoma (RMS) showing pleomorphic rhabdomyoblasts (arrow) intermingled with small polygonal cells (×10). (H) Desmin immunolabels mostly rhabdomyoblasts (×20). Methods are described in (18).
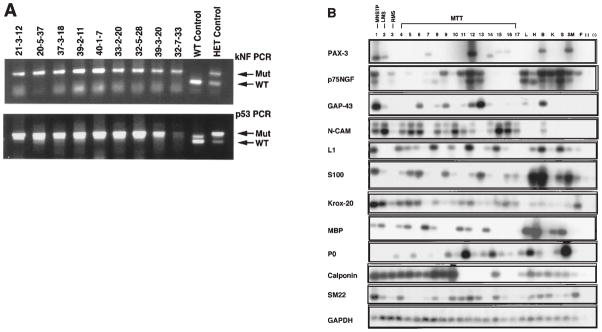
Expression of neural crest markers and LOH in cis-Nf1:p53 tumor cell lines (19). (A) DNAs from nine representative tumor lines that included MPNST, MTT, RMS, and LMS were assessed for LOH at Nf1 and p53. All tumor cell lines had complete LOH at both genes. Wild-type and heterozygous controls are shown for comparison. (B) Semiquantitative RT-PCR analysis of RNA obtained from representative cis-Nf1/p53 tumor-derived cell lines. Normal tissue samples from liver (L), heart (H), brain (B), kidney (K), spleen (S), skeletal muscle (SM), and NIH 3T3 fibroblasts (F) were used as controls. Samples lacking RT in the reaction mixture (−) were used as a negative control. Expression of the housekeeping gene GAPDH (GenBank accession no. M32599) was used as a loading control. Pax-3, paired box domain transcription factor (GenBank accession no. X59358); p75-NGF, NGF low-affinity receptor (GenBank accession no. X05137); GAP-43, growth-associated protein 43 (GenBank accession no. M16228); N-CAM, neural cell adhesion molecule (GenBank accession no. X15052); L1, immunoglobulin-related adhesion molecule (GenBank accession no. X12875); S100, calcium binding S100 protein (GenBank accession no. L22144); Krox-20, serum response zinc finger protein (GenBank accession no. X06746); MBP, myelin basic protein (GenBank accession no. M15060); P0, myelin P0 protein precursor (GenBank accession no. M62857); calponin (GenBank accession no. Z19542); SM22, smooth muscle protein 22 (GenBank accession no. 1351075) (19).
References
Publication types
MeSH terms
Substances
Grants and funding
LinkOut - more resources
Full Text Sources
Other Literature Sources
Medical
Molecular Biology Databases
Research Materials
Miscellaneous
