. 2000 Jan;20(1):299-311.
doi: 10.1128/MCB.20.1.299-311.2000.

Activated mutants of SHP-2 preferentially induce elongation of Xenopus animal caps

Affiliations

Activated mutants of SHP-2 preferentially induce elongation of Xenopus animal caps

A M O'Reilly et al. Mol Cell Biol. 2000 Jan.

Abstract

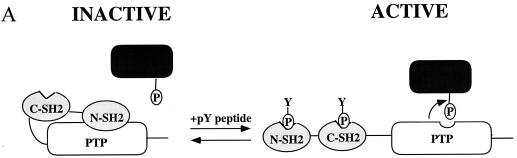
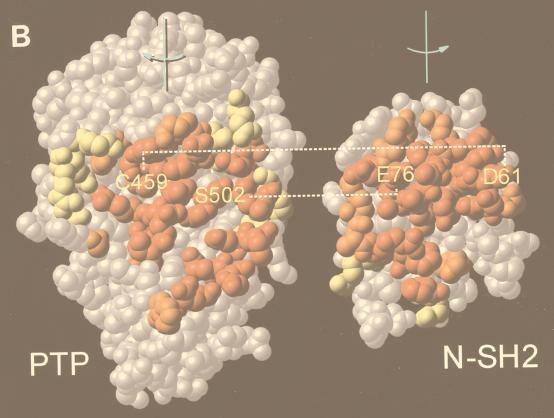
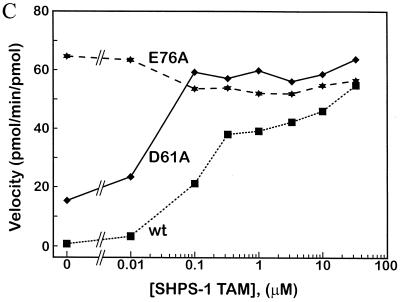
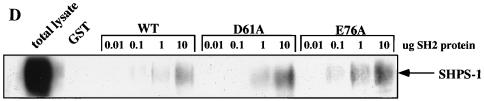
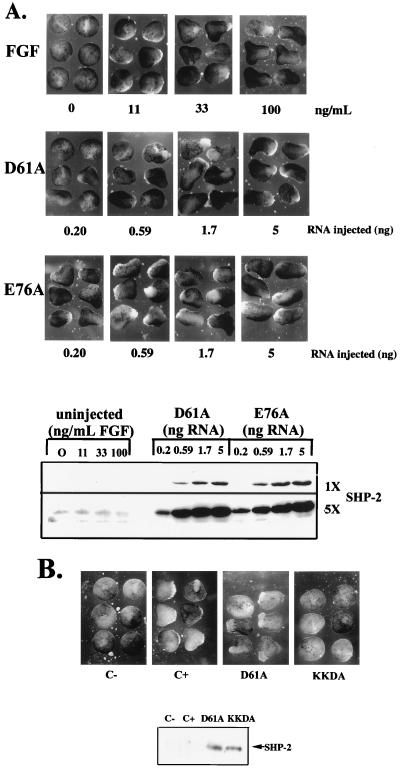
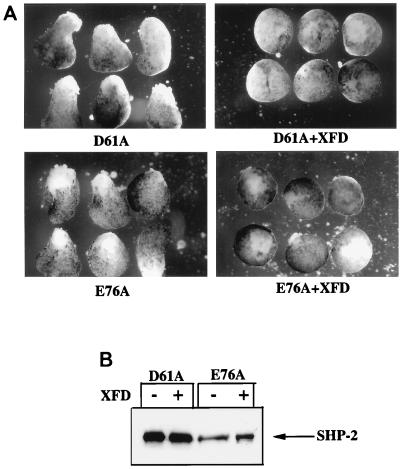
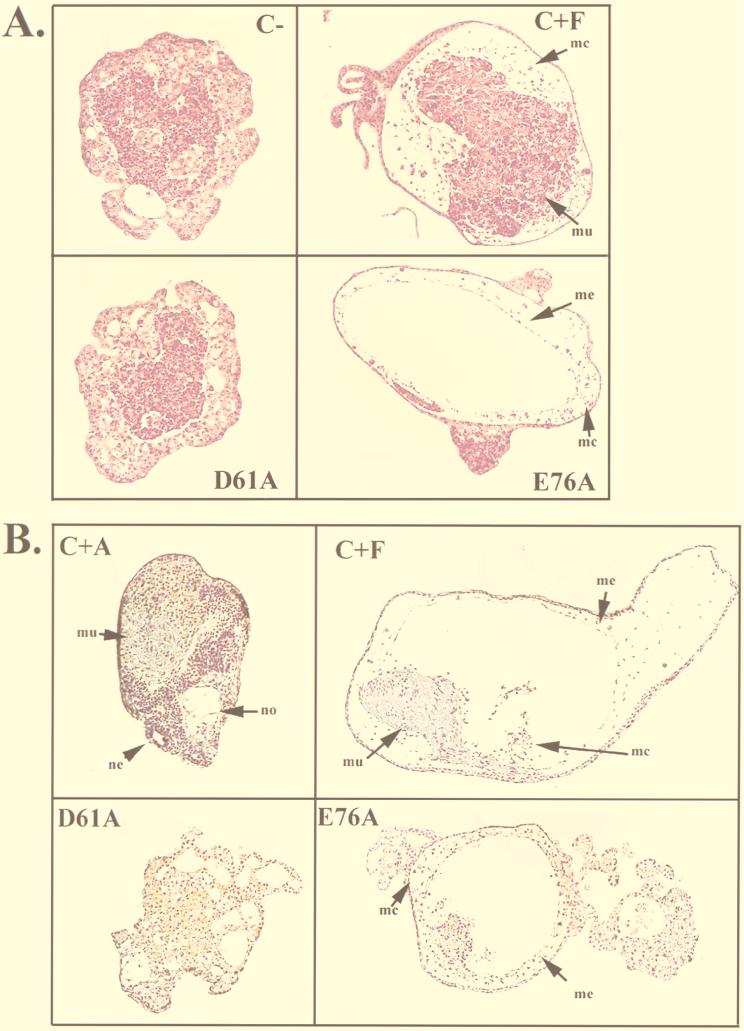
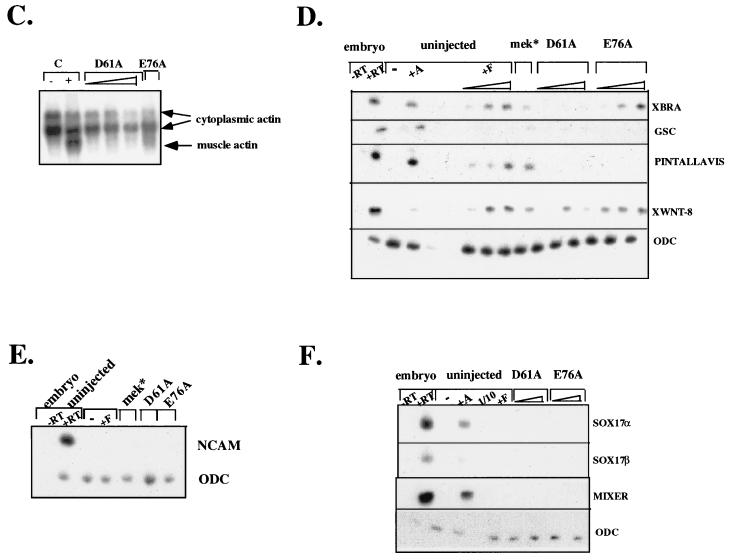
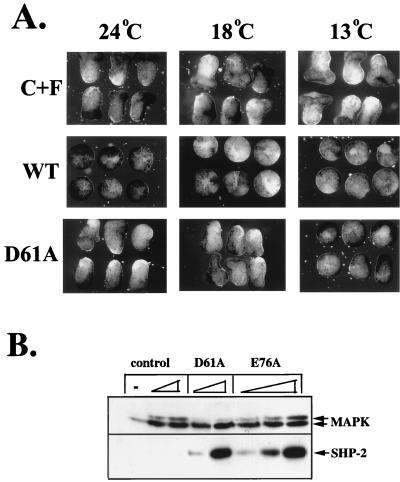
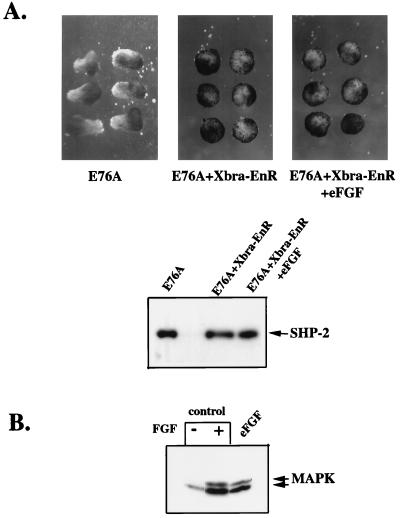
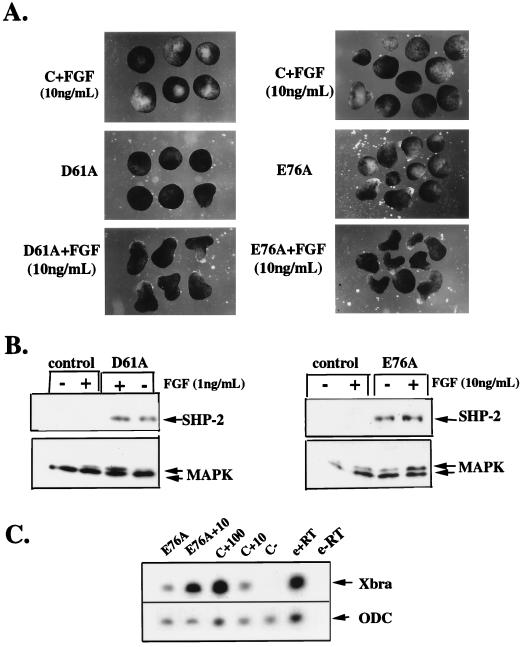
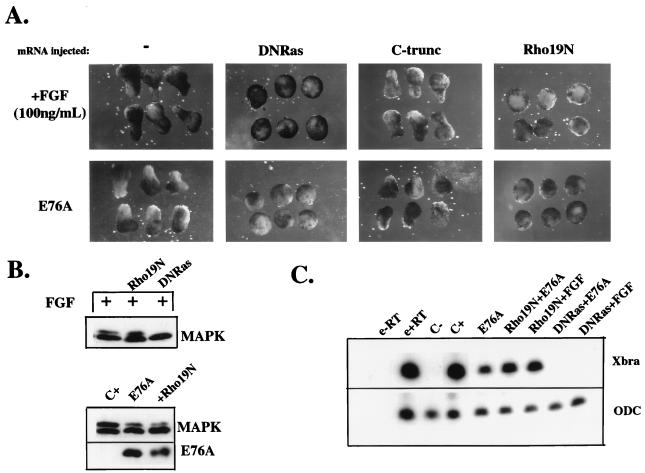
In Xenopus ectodermal explants (animal caps), fibroblast growth factor (FGF) evokes two major events: induction of ventrolateral mesodermal tissues and elongation. The Xenopus FGF receptor (XFGFR) and certain downstream components of the XFGFR signal transduction pathway (e.g., members of the Ras/Raf/MEK/mitogen-activated protein kinase [MAPK] cascade) are required for both of these processes. Likewise, activated versions of these signaling components induce mesoderm and promote animal cap elongation. Previously, using a dominant negative mutant approach, we showed that the protein-tyrosine phosphatase SHP-2 is necessary for FGF-induced MAPK activation, mesoderm induction, and elongation of animal caps. Taking advantage of recent structural information, we now have generated novel, activated mutants of SHP-2. Here, we show that expression of these mutants induces animal cap elongation to an extent comparable to that evoked by FGF. Surprisingly, however, activated mutant-induced elongation can occur without mesodermal cytodifferentiation and is accompanied by minimal activation of the MAPK pathway and mesodermal marker expression. Our results implicate SHP-2 in a pathway(s) directing cell movements in vivo and identify potential downstream components of this pathway. Our activated mutants also may be useful for determining the specific functions of SHP-2 in other signaling systems.


Figures

FIG. 1
FIG. 1
Generation of activated mutants of SHP-2. (A) Schematic diagram of regulation of SHP-2 activity as proposed by Hof et al. (19). (B) “Open-book” view of binding surfaces. The PTP domain (left) and N-SH2 (right) are both rotated 90° but in opposite directions to expose the buried surface between them. Contact residues are color coded to reflect the percentage of surface buried (red, 50 to 100%; orange, 25 to 50%; yellow, 0 to 25%). Hydrogen bonding interactions between D61 and C459 and between E76 and S502 are indicated by dashed lines. (C) Catalytic activity of activated mutants. Specific activities (picomoles of 32P released per minute per picomole) of wild-type (wt) D61A, and E76A proteins are plotted versus SHPS-1 ligand concentration. (D) Pull-down experiments using increasing amounts of wild-type (WT) or mutant (D61A or E76A) GST–N-SH2 domain fusion proteins to bind endogenous tyrosyl-phosphorylated SHPS-1 from J77 macrophage cell lysates. Immunoblots of precipitated material were probed with anti-SHPS-1 antibodies.
FIG. 1
FIG. 1
Generation of activated mutants of SHP-2. (A) Schematic diagram of regulation of SHP-2 activity as proposed by Hof et al. (19). (B) “Open-book” view of binding surfaces. The PTP domain (left) and N-SH2 (right) are both rotated 90° but in opposite directions to expose the buried surface between them. Contact residues are color coded to reflect the percentage of surface buried (red, 50 to 100%; orange, 25 to 50%; yellow, 0 to 25%). Hydrogen bonding interactions between D61 and C459 and between E76 and S502 are indicated by dashed lines. (C) Catalytic activity of activated mutants. Specific activities (picomoles of 32P released per minute per picomole) of wild-type (wt) D61A, and E76A proteins are plotted versus SHPS-1 ligand concentration. (D) Pull-down experiments using increasing amounts of wild-type (WT) or mutant (D61A or E76A) GST–N-SH2 domain fusion proteins to bind endogenous tyrosyl-phosphorylated SHPS-1 from J77 macrophage cell lysates. Immunoblots of precipitated material were probed with anti-SHPS-1 antibodies.
FIG. 2
FIG. 2
Expression of activated mutants induces elongation of Xenopus animal caps. (A) (Top panel) Stage 8 animal caps were stimulated with increasing concentrations of FGF, as indicated. Photographs were taken at stage 11.5 to assess elongation. (Second panel) Animal caps were isolated from embryos injected with threefold serial dilutions of D61A mRNA. No exogenous stimulus was applied, and elongation was assessed as above. (Third panel) Animal caps were isolated from embryos injected with the indicated dilutions of E76A in the absence of additional stimuli and analyzed as above. (Bottom panel) Levels of expression of the D61A and E76A proteins in this experiment. Two exposures of the SHP-2 immunoblot, representing fivefold differences in exposure time, are shown to indicate the relative level of expression of the activated mutants compared with endogenous SHP-2. (B) Animal caps were isolated from either uninjected embryos or embryos injected with D61A or KKDA RNA (1.7 ng). Uninjected animal caps were either left unstimulated (C−) or stimulated with FGF (100 ng/ml; Upstate Biotechnology, Inc.) (C+). No exogenous stimulus was applied to animal caps injected with D61A or KKDA RNA. Elongation was assessed as above.
FIG. 3
FIG. 3
A functional XFGFR is required for the effects of the activated SHP-2 mutants. (A) Animal caps were injected with 5 ng of either D61A or E76A RNA (left) or coinjected with the indicated activated SHP-2 mutant and XFD (2.5 ng) (right). (B) Protein levels for D61A and E76A. Control experiments indicated that the dose of XFD used was sufficient to inhibit all FGF signaling in animal caps (data not shown).
FIG. 4
FIG. 4
Analysis of differentiation in animal caps expressing activated mutants of SHP-2. (A and B) Histological sections from stage 39 animal caps that were unstimulated (C−) or stimulated with activin (5 ng/ml) (C+A) or FGF (100 ng/ml) (C+F) or expressing D61A or E76A. The levels of D61A and E76A protein in these animal caps were equivalent (data not shown). Sections were stained with hematoxylin and eosin (A) or Feulgan/light green/orange G (B). Notochord (no), neural tissue (ne), muscle (mu), mesothelium (me), and mesenchyme (mc) are indicated. (C) Northern analysis of the late mesodermal marker muscle actin. Animal caps collected at stage 21 were analyzed for muscle actin mRNA (lowest band). The two upper bands represent cytoplasmic actin, which cross-reacts with the probe and serves as a loading control. The mRNA injected is indicated above each lane. The triangle under D61A represents successive threefold dilutions of D61A RNA, with the maximal dose being 5 ng. (D) RT-PCR analysis of stage 11 animal caps. Animal caps were stimulated with activin (+A, 5 ng/ml) or threefold dilutions of FGF (+F), with the highest concentration being 100 ng/ml. Alternatively, animal caps were injected with fivefold dilutions of D61A or E76A mRNA, with the maximum injection being 5 ng, or with 50 ng of activated MEK (mek*) RNA, in the absence of any additional stimulation. RNA was isolated from animal caps or normal embryos at stage 11 and subjected to RT-PCR analysis with the indicated primers as described in Materials and Methods. All of the markers in this panel were isolated from a single experiment; ODC expression served as a loading control for all markers. Similar results were obtained in a minimum of three independent experiments. −RT indicates negative control RT-PCR reactions carried out in the absence of reverse transcriptase. Note that similar results were observed when RNA was isolated at stage 10. (E) RT-PCR analysis of NCAM expression in stage 21 animal caps expressing the indicated proteins or left uninjected. ODC serves as a control for equal loading. (F) RT-PCR analysis of endodermal marker expression in stage 11 animal caps isolated as for panel D.
FIG. 4
FIG. 4
Analysis of differentiation in animal caps expressing activated mutants of SHP-2. (A and B) Histological sections from stage 39 animal caps that were unstimulated (C−) or stimulated with activin (5 ng/ml) (C+A) or FGF (100 ng/ml) (C+F) or expressing D61A or E76A. The levels of D61A and E76A protein in these animal caps were equivalent (data not shown). Sections were stained with hematoxylin and eosin (A) or Feulgan/light green/orange G (B). Notochord (no), neural tissue (ne), muscle (mu), mesothelium (me), and mesenchyme (mc) are indicated. (C) Northern analysis of the late mesodermal marker muscle actin. Animal caps collected at stage 21 were analyzed for muscle actin mRNA (lowest band). The two upper bands represent cytoplasmic actin, which cross-reacts with the probe and serves as a loading control. The mRNA injected is indicated above each lane. The triangle under D61A represents successive threefold dilutions of D61A RNA, with the maximal dose being 5 ng. (D) RT-PCR analysis of stage 11 animal caps. Animal caps were stimulated with activin (+A, 5 ng/ml) or threefold dilutions of FGF (+F), with the highest concentration being 100 ng/ml. Alternatively, animal caps were injected with fivefold dilutions of D61A or E76A mRNA, with the maximum injection being 5 ng, or with 50 ng of activated MEK (mek*) RNA, in the absence of any additional stimulation. RNA was isolated from animal caps or normal embryos at stage 11 and subjected to RT-PCR analysis with the indicated primers as described in Materials and Methods. All of the markers in this panel were isolated from a single experiment; ODC expression served as a loading control for all markers. Similar results were obtained in a minimum of three independent experiments. −RT indicates negative control RT-PCR reactions carried out in the absence of reverse transcriptase. Note that similar results were observed when RNA was isolated at stage 10. (E) RT-PCR analysis of NCAM expression in stage 21 animal caps expressing the indicated proteins or left uninjected. ODC serves as a control for equal loading. (F) RT-PCR analysis of endodermal marker expression in stage 11 animal caps isolated as for panel D.
FIG. 5
FIG. 5
Activated mutants induce minimal MAPK activation. (A) Cold sensitivity of D61A mutant. Embryos were injected with wild-type (WT) or D61A RNA (5 ng) at the two-cell stage and cultured at 13°C until stage 8. Animal caps were excised and then incubated at the indicated temperatures. C+F, uninjected plus FGF (100 ng/ml). (B) Immunoblot analysis of injected animal caps at stage 8. Total lysates from animal caps injected with activated mutant RNA, as indicated, in the absence of any additional stimulation, or from uninjected caps stimulated with the indicated concentrations of FGF were probed with anti-ERK2 or anti-SHP-2 antibodies. MAPK activation is indicated by a decrease in electrophoretic mobility.
FIG. 6
FIG. 6
Inhibition of Xbra activity prevents activated mutant-induced elongation. (A) Animal caps injected with E76A (5 ng), E76A (5 ng) and Xbra-EnR (200 pg), or E76A (5 ng), Xbra-EnR (200 pg), and eFGF (5 pg) were left unstimulated and allowed to develop until stage 11.5, when elongation was scored. (B) MAPK activation was assessed as in Fig. 5 in animal caps left unstimulated, stimulated with 100 ng of FGF per ml, or injected with 5 pg of eFGF.
FIG. 7
FIG. 7
Activated SHP-2 mutants synergize with FGF. (A) Animal caps were either uninjected (top panel) or injected with 0.2 ng of D61A (left side, middle panel) or 0.2 ng E76A (right side, middle panel). Uninjected animal caps (top panel) or activated mutant-injected animal caps (bottom panel) were stimulated with exogenously added FGF (11 ng/ml) and analyzed for elongation as in Fig. 2. (B) Total lysates from animal caps injected with D61A (left panel) or E76A (right panel) or from uninjected or activated mutant-injected animal caps stimulated with the indicated concentrations of FGF were probed with anti-ERK2 or anti-SHP-2 antibodies. (C) RNA was isolated from stage 10 animal caps (treated as indicated) and subjected to RT-PCR analysis using a primer for Xbra or ODC (see Materials and Methods). E76A+10, injected with E76A and stimulated with FGF (10 ng/ml); C+100, uninjected plus FGF (100 ng/ml); C+10, uninjected plus FGF (10 ng/ml); C−, uninjected controls; e+RT, stage 10 embryos plus reverse transcriptase; e−RT, stage 10 embryos with no reverse transcriptase.
FIG. 8
FIG. 8
Pathways required for signaling by activated SHP-2 mutants. (A) Animal caps injected with RNA encoding DNRas (64) (5 ng), C-trunc (33) (20 pg), or Rho19N (100 pg), as indicated, were analyzed for elongation after either stimulation with FGF (100 ng/ml) or coinjection with E76A (5 ng). (B) Analysis of the effects of DNRas and Rho19N on MAPK activation induced either by FGF (above) or expression of E76A (below). Total lysates were probed with anti-ERK2 or anti SHP-2 antibodies as in Fig. 5. (C) RNA was isolated from stage 10 animal caps injected with the indicated RNAs (see legend to panel A for amounts) and subjected to RT-PCR analysis using primers for Xbra or ODC, as indicated. Lanes are labeled as in Fig. 7C.

Similar articles

Cited by

References

    1. Allard J D, Chang H C, Herbst R, McNeill H, Simon M A. The SH2-containing tyrosine phosphatase corkscrew is required during signaling by sevenless, Ras1 and Raf. Development. 1996;122:1137–1146. - PubMed
    1. Amaya E, Musci T J, Kirschner M W. Expression of a dominant negative mutant of the FGF receptor disrupts mesoderm formation in Xenopus embryos. Cell. 1991;66:257–260. - PubMed
    1. Barford D, Neel B G. Revealing mechanisms for SH2 domain-mediated regulation of the protein tyrosine phosphatase SHP-2. Structure. 1998;6:249–254. - PubMed
    1. Barrett K, Leptin M, Settleman J. The Rho GTPase and a putative RhoGEF mediate a signaling pathway for the cell shape changes in Drosophila gastrulation. Cell. 1997;91:905–915. - PubMed
    1. Brieher W, Gumbiner B. Regulation of C-Cadherin function during activin induced morphogenesis of Xenopus animal caps. J Cell Biol. 1994;126:519–527. - PMC - PubMed

Publication types

MeSH terms

Substances