. 2000 Jan;20(1):389-401.
doi: 10.1128/MCB.20.1.389-401.2000.

DNA binding site selection of dimeric and tetrameric Stat5 proteins reveals a large repertoire of divergent tetrameric Stat5a binding sites

Affiliations

DNA binding site selection of dimeric and tetrameric Stat5 proteins reveals a large repertoire of divergent tetrameric Stat5a binding sites

E Soldaini et al. Mol Cell Biol. 2000 Jan.

Abstract

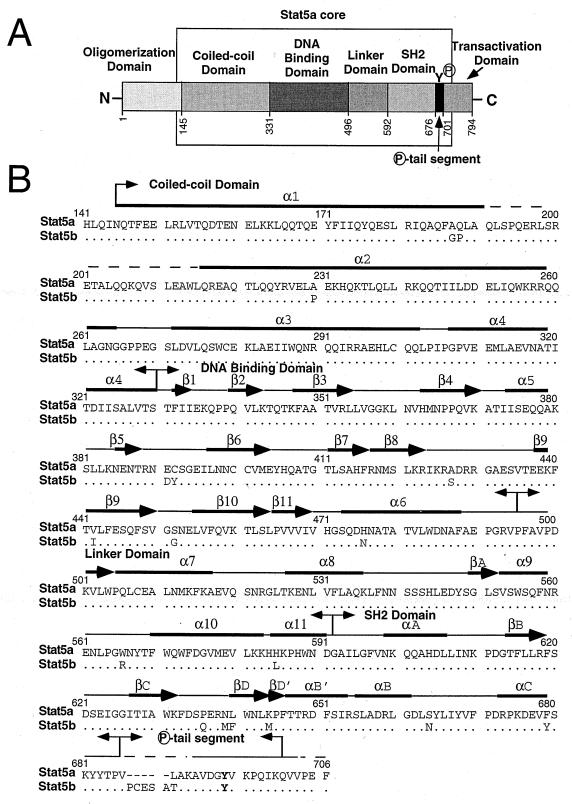
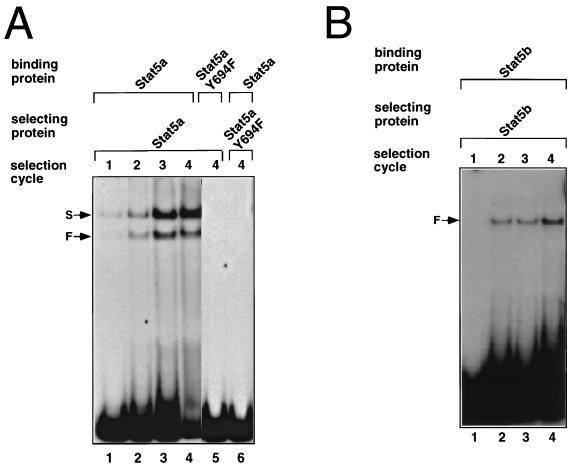
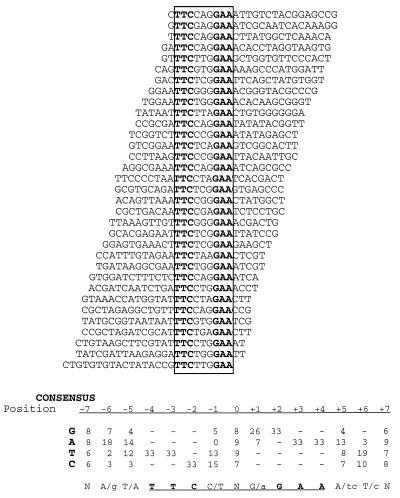
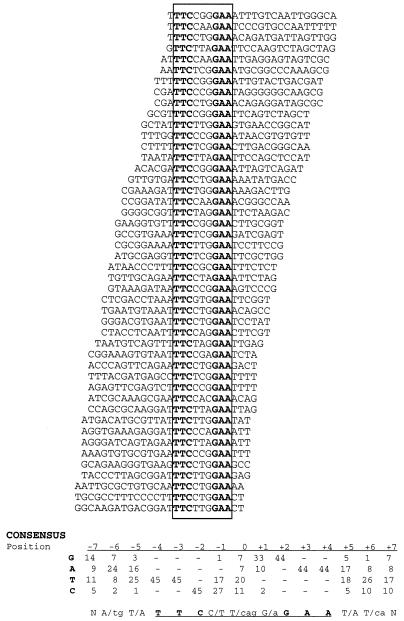
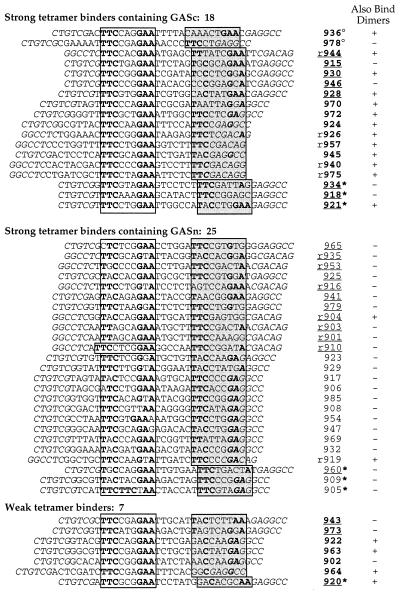
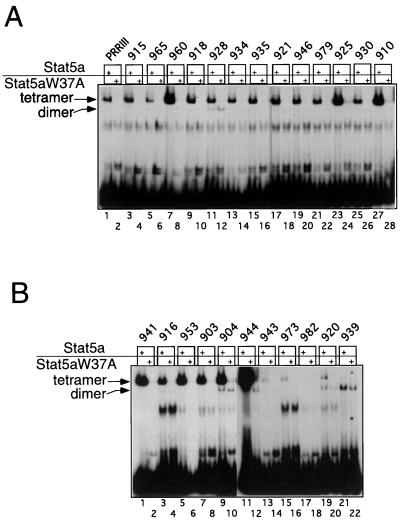
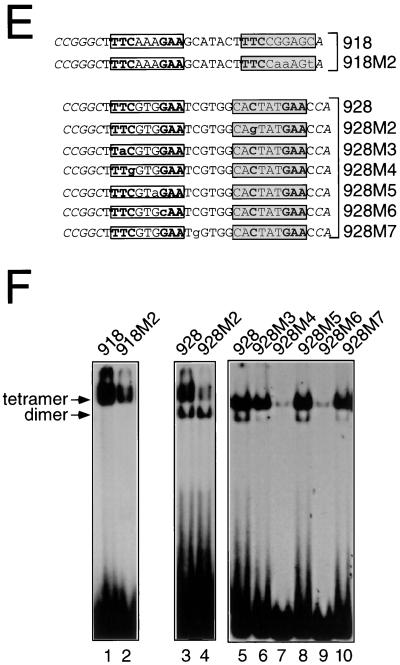
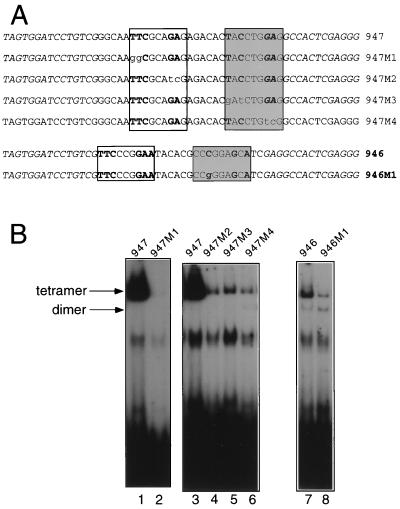
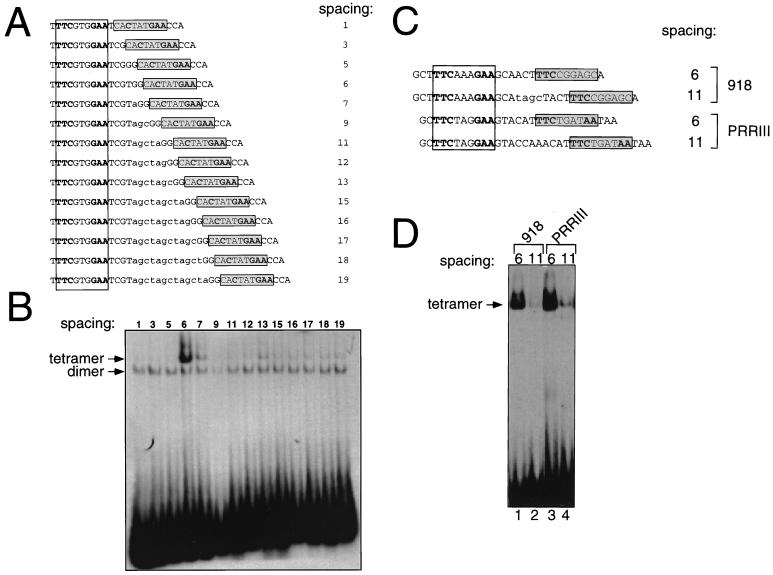
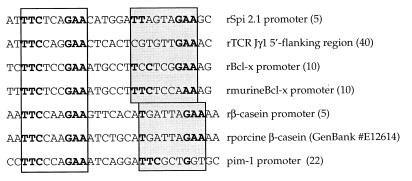
We have defined the optimal binding sites for Stat5a and Stat5b homodimers and found that they share similar core TTC(T/C)N(G/A)GAA interferon gamma-activated sequence (GAS) motifs. Stat5a tetramers can bind to tandemly linked GAS motifs, but the binding site selection revealed that tetrameric binding also can be seen with a wide range of nonconsensus motifs, which in many cases did not allow Stat5a binding as a dimer. This indicates a greater degree of flexibility in the DNA sequences that allow binding of Stat5a tetramers than dimers. Indeed, in an oligonucleotide that could bind both dimers and tetramers, it was possible to design mutants that affected dimer binding without affecting tetramer binding. A spacing of 6 bp between the GAS sites was most frequently selected, demonstrating that this distance is favorable for Stat5a tetramer binding. These data provide insights into tetramer formation by Stat5a and indicate that the repertoire of potential binding sites for this transcription factor is broader than expected.


Figures

FIG. 1
FIG. 1
Domain structure and sequence alignment of Stat5 proteins. (A) Schematic representation of Stat5 proteins: the domain boundaries of human Stat5a are shown. The Stat5a core region (residues 141 to 706) used to construct the computer model shown in Fig. 6 is indicated by the open box. (B) Sequence alignment of the core regions of human Stat5a and Stat5b. Dots indicate identical nucleotides; hyphens are gaps introduced to optimize alignment. Amino acids in the DNA binding domain which differ between Stat5a and Stat5b are indicated. The loop which intercalates into the major groove of DNA is in the “DNA binding domain” box. Tyr694 of Stat5a and Tyr699 of Stat5b are in boldface. Arrows indicate β strands, and solid bars indicate α-helices, as predicted from the molecular modeling of Stat5. Panels A and B were adapted from Fig. 1A and B in reference , with the permission of Cell and J. Kuriyan.
FIG. 2
FIG. 2
Characterization of purified Stat5 proteins by Western blotting. Baculoviruses encoding Stat5a, Stat5b, Stat5aY694F, or Stat5aW37A were used to infect insect cells. Recombinant proteins were purified, analyzed on sodium dodecyl sulfate-polyacrylamide gels, and either silver stained (A) or immunoblotted by using antibodies to Stat5a and Stat5b (Stat5; B), anti-Stat5a (C), anti-Stat5b (D), or phosphotyrosine (PY20; E).
FIG. 3
FIG. 3
Binding site selection for Stat5a. (A) DNA selected at sequential cycles by Stat5a were used as probes in EMSAs with Stat5a (lanes 1 to 4). The faster complex (F) comigrated with Stat5a dimers, and the slower complex (S) migrated with Stat5a tetramers. Stat5aY694F did not bind to DNA selected by the wild-type protein (lane 5) and did not select for Stat5a binding sites (lane 6). (B) Same as for panel A, except that Stat5b was used.
FIG. 4
FIG. 4
Alignment of 33 Stat5a dimer-selected DNAs. Sequences and nucleotide frequency in 33 binding sites selected by Stat5a homodimers after four cycles of selection (lane 4 of Fig. 3A). Nine of these DNAs were tested with Stat5a in EMSAs, and each bound Stat5a dimers. Not included in the figure are 10 sequences that lacked canonical GAS motifs, since the five of these that were tested in EMSAs were all proven to be falsely selected sequences that could not bind dimeric Stat5a. All sequences are shown in the same orientation relative to the flanking sequences (top strand). The conserved consensus GAS motif is boxed; its central nucleotide was assigned position zero. The consensus Stat5a binding motif was derived from the nucleotide frequencies in the binding sites in the figure. At each position, the more-favored nucleotides are shown in upper case letters, while less-favored nucleotides are in lower case.
FIG. 5
FIG. 5
Alignment of 45 Stat5b dimer-selected DNAs. Sequences and nucleotide frequency in 45 binding sites selected by Stat5b homodimers after four cycles of selection (lane 4 of Fig. 3B). Ten of these DNAs were tested in EMSAs and shown to bind Stat5b dimers. Not included are 27 sequences that lacked consensus GAS motifs, since the 12 of these that were tested in EMSAs were found to be falsely selected sequences that could not bind dimeric Stat5b. All sequences are shown in the same orientation relative to the flanking sequences (top strand). The conserved consensus Stat5b binding motif was derived from the nucleotide frequencies in the binding sites in the figure. At each position, the more-favored nucleotides are shown in upper case letters, while less-favored nucleotides are in lower case.
FIG. 6
FIG. 6
The 18 amino acid differences between the Stat5a and Stat5b cores appear to be remote from DNA binding surface. Superimposed structures of human Stat5a (red) and Stat5b (yellow) core monomers were obtained by homology modeling. The 18 amino acids which differ between Stat5a and Stat5b (see Fig. 1B) are indicated as follows: 1, A187G; 2, Q188P; 3, A230P; 4, E391D; 5, C392Y; 6, A427S; 7, V442I; 8, S452G; 9, H476N; 10, W566R; 11, H585L; 12, P636Q; 13, N639M; 14, L640F; 15, K644M; 16, S664N; 17, F679Y; and 18, L687T. The first letter and number represent the residue in Stat5a, while the second letter represents the corresponding residue in Stat5b. Five residues, PCESA, are present in Stat5b (amino acids 687 to 691) but not Stat5a.
FIG. 7
FIG. 7
Alignment of 50 Stat5a tetramer-selected DNAs. Sequences of 50 binding sites selected by Stat5a tetramers after four cycles of selection (lane 4 of Fig. 3A). All of the sequences shown bound Stat5a tetramers in EMSAs. Not shown are nine sequences that were selected but which were unable to bind Stat5 tetramers. Shown are sequences containing a consensus GAS motif (top 18 sequences) or a nonconsensus GAS motif (middle 25 sequences). As noted in the text, the bottom seven sequences bound Stat5a tetramers relatively poorly. The nucleotides in italics correspond to sequences from the nonrandom flanking sequences of R76; these are included as the GAG in the 3′ flank was shown in Fig. 11 to be important for tetrameric Stat5a binding to oligonucleotide 947. Note that this GAG was often 3 bp downstream of a TTC, thus forming nonconsensus GAS motifs. On the right are sequence identifiers. Those containing sequences with GASc motifs are in boldface. An “r” before a sequence identifier indicates that the bottom rather than top strand is shown to align the GASc or GASn shown in the open box 5′ to the more-divergent sequence shown in the shaded boxes. Underlined numbers refer to sequences that were evaluated by EMSA in Fig. 8. Superscripted “○” and “∗” symbols refer to sequences with spacings of 5 and 7 bp between the boxed regions, respectively. The ability of the tetramer-selected sequences to bind Stat5a as a dimer is indicated.
FIG. 8
FIG. 8
Representative EMSAs from oligonucleotides selected in the binding site selection with Stat5a corresponding to the slower-mobility complex. The panels show binding with Stat5a (150 ng) or an equivalent amount of mutant Stat5aW37A protein. The sequences for the oligonucleotides used are shown in Fig. 7 except for 982 and 939 (5′-TCTTCGTGGAAGCAGCGTGGCAGGTA-3′ and 5′-TTCCTGGAAATGGATATTAGTACCCC-3′, respectively). In each oligonucleotide, the consensus GAS motif is underlined with the TTC and GAA shown in boldface; a 9-bp segment downstream which could represent a second divergent GAS motif is also underlined. In each case, the similarity of these putative GAS motifs is remote, as indicated by the nucleotides in boldface. Accordingly, neither of these sequences bound Stat5a tetramers (panel B, lanes 17 and 21). The sequence of the PRRIII oligonucleotide is 5′-TCTTCTAGGAAGTACCAAACATTTCTGATAATA-3′. All of the oligonucleotides also included 15 constant nucleotides both 5′ and 3′ to facilitate labeling by PCR (see Materials and Methods).
FIG. 9
FIG. 9
Obligatory role of half-GAS sites present in binding sites selected in the slower-migrating complex that corresponds to Stat5a tetramers. (A) Schematic representation of the probes used in the EMSAs shown in panel B. The 26 nucleotides selected by the Stat5a slower complex in the clones analyzed (918, 928, and 934) are in plain text, while the artificially introduced flanking nucleotides are in italics. The nucleotide changes introduced in their mutated versions (918M1, 928M1, and 934M1) are in lowercase letters. The consensus GAS elements are in the open box, while the nonconsensus GAS elements are in the shadowed boxes. Consensus half-sites are in boldface. (B) EMSAs were performed with Stat5a (150 ng) or with an equivalent amount of Stat5aW37A, and the probes shown in panel A, which were labeled by Klenow fill-in.
FIG. 10
FIG. 10
Methylation interference analysis of dimeric or tetrameric Stat5a. (A) Oligonucleotide 918 was labeled either on the sense (TOP) or antisense (bottom [BOT]) strand, methylated with dimethyl sulfate, and incubated with Stat5a. Shown are piperidine-mediated cleavages of free probe (F) or of probe bound (B) to a Stat5a tetramer. (B and C), Comparison of the nucleotide contacts between tetrameric or dimeric Stat5a and oligonucleotide 928. The same analysis as in panel A was performed with oligonucleotide 928, either free (F) or bound (B) to a Stat5a tetramer (B) or to a Stat5aW37A dimer (C). Nucleotides which interfered with binding of tetramers but not of dimers are indicated with an arrow. Filled circles indicate strong interference, while asterisks indicate hypermethylation. The artificially introduced flanking nucleotides are in italics. The consensus GAS element is in an open box, while the nonconsensus GAS element is in a shadowed box. (D) Summary of methylation interference analyses shown in panels A, B, and C. (E) Wild-type and mutant forms of oligonucleotides 918 and 928. (F) The oligonucleotides in panel E were labeled by Klenow fill-in and used in EMSAs with 150 ng of Stat5a.
FIG. 10
FIG. 10
Methylation interference analysis of dimeric or tetrameric Stat5a. (A) Oligonucleotide 918 was labeled either on the sense (TOP) or antisense (bottom [BOT]) strand, methylated with dimethyl sulfate, and incubated with Stat5a. Shown are piperidine-mediated cleavages of free probe (F) or of probe bound (B) to a Stat5a tetramer. (B and C), Comparison of the nucleotide contacts between tetrameric or dimeric Stat5a and oligonucleotide 928. The same analysis as in panel A was performed with oligonucleotide 928, either free (F) or bound (B) to a Stat5a tetramer (B) or to a Stat5aW37A dimer (C). Nucleotides which interfered with binding of tetramers but not of dimers are indicated with an arrow. Filled circles indicate strong interference, while asterisks indicate hypermethylation. The artificially introduced flanking nucleotides are in italics. The consensus GAS element is in an open box, while the nonconsensus GAS element is in a shadowed box. (D) Summary of methylation interference analyses shown in panels A, B, and C. (E) Wild-type and mutant forms of oligonucleotides 918 and 928. (F) The oligonucleotides in panel E were labeled by Klenow fill-in and used in EMSAs with 150 ng of Stat5a.
FIG. 11
FIG. 11
Critical role of nucleotides which do not form half-GAS sites for binding of Stat5a tetramers. (A) Sequences of wild-type and mutant forms of oligonucleotides 946 and 947. (B) EMSAs performed with the oligonucleotides in panel A were labeled by PCR (see Materials and Methods) and 150 ng of Stat5a.
FIG. 12
FIG. 12
A spacing of 6 bp between GAS sites is optimal for Stat5a tetramer formation. (A) Schematic representation of the probes used in EMSAs shown in panel B. This series of oligonucleotides was based on oligonucleotide 928 (see Fig. 9A for the artificially introduced flanking nucleotides), in which the consensus (open box) and nonconsensus (shadowed box) GAS elements were 6 bp apart. This spacing was varied either by removing intermediate base pairs (spacing of 1, 3, or 5 bp) or by adding them (lowercase letters, spacing of ≥7 bp). (B) EMSAs were performed with 20 ng of Stat5a and the probes shown in panel A. (C) Schematic representation of the probes used in EMSAs shown in panel D; see Fig. 9A for the artificially introduced flanking nucleotides. The distance between the consensus (open box) and nonconsensus (shadowed box) GAS elements present in oligonucleotide 918 (7 bp) was either reduced to 6 bp (lane 1) or increased to 11 bp (lane 2). The naturally occurring inter-GAS distance of 11 bp in PRRIII (lane 4) was reduced to 6 bp (lane 3). Stat5a was used at 150 ng in EMSAs shown in lanes 1 and 2 and 20 ng for lanes 3 and 4. Probes were labeled by Klenow fill-in.
FIG. 13
FIG. 13
Putative tetramer binding sites in Stat5 responsive gene. An “r” before the sequence name indicates that the bottom rather than top strand is shown to align the GASc shown in the open box 5′ to the more divergent sequence shown in the shaded boxes, analogous to the sequences in Fig. 7. The numbers in parentheses are the references from which the sequences were derived; for porcine β-casein, a GenBank accession number is shown.

Similar articles

Cited by

References

    1. Azam M, Erdjument-Bromage H, Kreider B L, Xia M, Quelle F, Basu R, Saris C, Tempst P, Ihle J N, Schindler C. Interleukin-3 signals through multiple isoforms of Stat5. EMBO J. 1995;14:1402–1411. - PMC - PubMed
    1. Baldwin A S J. Methylation interference assay for analysis of DNA-protein interactions. In: Ausubel F M, Brent R, Kingston R E, Moore D D, Seidman J G, Smith J A, Struhl K, editors. Current protocols in molecular biology. Vol. 2. New York, N.Y: Greene Publishing Associates/Wiley-Interscience; 1987. pp. 12.3.1–12.3.4. - PubMed
    1. Beadling C, Ng J, Babbage J W, Cantrell D A. Interleukin-2 activation of STAT5 requires the convergent action of tyrosine kinases and a serine/threonine kinase pathway distinct from the Raf1/ERK2 MAP kinase pathway. EMBO J. 1996;15:101–112. - PMC - PubMed
    1. Becker S, Groner B, Muller C W. Three-dimensional structure of the Stat3β homodimer bound to DNA. Nature. 1998;394:145–151. - PubMed
    1. Bergad P L, Shih H-M, Towle H C, Schwarzenberg S J, Berry S A. Growth hormone induction of hepatic serine protease inhibitor 2.1 transcription is mediated by a Stat5-related factor binding synergistically to two γ-activated sites. J Biol Chem. 1995;270:24903–24910. - PubMed

MeSH terms

LinkOut - more resources