. 1999 Dec 15;19(24):10727-37.
doi: 10.1523/JNEUROSCI.19-24-10727.1999.

Control of action potential timing by intrinsic subthreshold oscillations in olfactory bulb output neurons

Affiliations

Control of action potential timing by intrinsic subthreshold oscillations in olfactory bulb output neurons

D Desmaisons et al. J Neurosci. .

Abstract

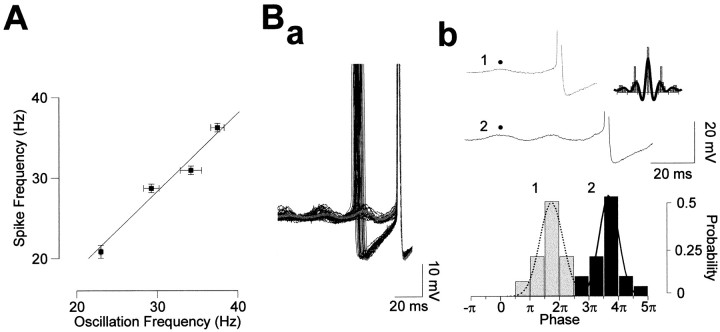
Rhythmic patterns of neuronal activity have been found at multiple levels of various sensory systems. In the olfactory bulb or the antennal lobe, oscillatory activity exhibits a broad range of frequencies and has been proposed to encode sensory information. However, the neural mechanisms underlying these oscillations are unknown. Bulbar oscillations might be an emergent network property arising from neuronal interactions and/or resulting from intrinsic oscillations in individual neurons. Here we show that mitral cells (output neurons of the olfactory bulb) display subthreshold oscillations of their membrane potential. These oscillations are mediated by tetrodotoxin-sensitive sodium currents and range in frequency from 10 to 50 Hz as a function of resting membrane potential. Because the voltage dependency of oscillation frequency was found to be similar to that for action potential generation, we studied how subthreshold oscillations could influence the timing of action potentials elicited by synaptic inputs. Indeed, we found that subthreshold oscillatory activity can trigger the precise occurrence of action potentials generated in response to EPSPs. Furthermore, IPSPs were found to set the phase of subthreshold oscillations and can lead to "rebound" spikes with a constant latency. Because intrinsic oscillations of membrane potential enable very precise temporal control of neuronal firing, we propose that these oscillations provide an effective means to synchronize mitral cell subpopulations during the processing of olfactory information.


Figures

Fig. 1.
Fig. 1.
The horizontal rat olfactory bulb slice preparation. A, Experimental arrangement for bipolar stimulating electrodes (S1 and S2) and the recording electrode (REC) in a schematic representation of the main olfactory bulb. ONL, Olfactory nerve layer; GL, glomerular layer;EPL, external plexiform layer; MCL, mitral cell body layer; GCL, granule cell layer.B, Camera lucida drawing of a mitral cell labeled intracellularly with biocytin.
Fig. 2.
Fig. 2.
Subthreshold membrane potential oscillations are voltage-dependent. A, Increasing depolarization by injection of a constant current triggers clustered action potentials interspersed by membrane potential oscillations (top two traces). Slow oscillations are observed at more hyperpolarized membrane potentials (bottom trace). B,Power spectrum (arbitrary units) reveals the dominant frequency of these oscillations (middle panel), whereas the autocorrelation indicates their rhythmic nature (right panel). Left, Expanded view of the oscillations at three different potentials used for the corresponding graphs (same cell as in A).C, Voltage dependency of oscillation frequency (filled symbols) and spike frequency (open symbols) from the same cell. Symbols represent the mean, and error bars indicate SEM. The spike frequency is calculated as the inverse of the mean of the first interspike interval within a cluster.
Fig. 3.
Fig. 3.
Relationship between subthreshold oscillations and spikes. A, The average oscillation frequency is plotted as a function of the mean spike frequency with a linear regression (k = 0.997). Each symbol represents the mean ± SEM. B, Temporal correlation between spikes and oscillations. a, Twenty superimposed spike-triggered traces and corresponding average of traces with one spike.b, Phase relationship between spikes and subthreshold potential oscillations. Traces were triggered on the last (trace1) or on the penultimate oscillation (trace2) before spike emission to establish a probability histogram of spike emission as a function of the oscillation phase. Results were fitted with Gaussian functions. Note the tendency for the cell to fire with a small phase advance. Inset, Autocorrelation of the subthreshold oscillations preceding a spike (continuous line), and autocorellogram of spikes (histogram) for the same potential, illustrating similar frequencies for the two events (spikes are clipped for clarity).
Fig. 4.
Fig. 4.
Pharmacology of subthreshold oscillations. Control traces recorded in standard medium (left) and in external medium containing either 1 μm tetrodotoxin (A), cobalt substituted for calcium (B), or with a lower KCl concentration (C), after a perfusion time, indicated inparentheses. Right panels, Corresponding autocorrelations. Note that oscillations were only abolished after bath application of TTX, whereas calcium withdrawal or lowering of external potassium affected neither their frequency nor their amplitude (Vhold = −62 mV for all traces).
Fig. 5.
Fig. 5.
IPSPs or hyperpolarizing pulses reset the phase of the oscillations. A, Intrinsic membrane potential oscillations recorded at the same potential in the absence (bottom trace) or the presence (top trace, asterisk) of a spontaneous IPSP. Note that the IPSP only resets the phase of the oscillations without affecting its frequency or amplitude. B, Mitral cell recorded in the presence of bicuculline (40 μm) and kynurenate (10 mm). A hyperpolarizing current pulse (arrowhead) is injected to mimic spontaneous IPSPs. From top to bottom, An individual voltage trace showing the triggering of oscillations by a current pulse; six superimposed traces; average of 20 trials compared to the average of traces without pulse. C, The hyperpolarizing pulse reset the phase of the oscillations without affecting their frequency. Left, Corresponding averaged autocorrelations without (Spont.), 5 msec (Stim + 5 msec), or 150 msec after the hyperpolarizing pulse (Stim + 150 msec). No change in frequency can be detected. Right, Averaged cross-correlation obtained from voltage recordings in the same conditions. Results from this correlation can be taken as an index of phase coherence. Note that the subthreshold oscillations are only rephased during 150 msec after the pulse.
Fig. 6.
Fig. 6.
Spontaneous IPSPs or hyperpolarizing current pulses can generate rebound spikes. A, A hyperpolarizing current pulse (arrowhead) can elicit a rebound spike.Left, Superimposed sweeps (n = 8) illustrating the phasing of spiking after the current pulse.Right, Associated PSTH from all trials (n = 16). B, Spontaneous IPSPs (asterisk) can also elicit a rebound spike. Five superimposed traces triggered by spontaneous IPSPs(left), and the corresponding PSTH obtained from 23 sweeps (right) showing a marked peak at 30 msec after the spontaneous IPSP. C, Relationship between the IPSP slope and the spike delay. Note the absence of any correlation (r = 0.38). Inset, Histogram of spike latency.
Fig. 7.
Fig. 7.
The rebound spike delay is independent from the membrane potential and does not depend on how it is generated.A, Mean ± SD of the delay between the hyperpolarizing pulse and the spike initiation as a function of the membrane potential for the same cell. Note the absence of correlation (r = 0.08; p > 0.8).B, Cumulative probability plots for the spike latency after hyperpolarizing pulses (filled symbols;n = 21 cells) or IPSPs (open symbols; n = 8 cells). The difference between these two populations is not significant (p > 0.05). Inset shows two superimposed voltage traces from the same cell illustrating the rebound spike after a current pulse or a spontaneous IPSP.
Fig. 8.
Fig. 8.
Subthreshold membrane potential oscillations and EPSP integration. A, Voltage traces illustrating the experimental protocol. Aa, A trace showing spontaneous membrane potential oscillations and (Ab) sinusoidal current-induced membrane oscillations. Ac, Averaged evoked EPSP (10 trials) induced by stimulation (arrowhead) in the EPL. B, Membrane oscillations act as a timing device for EPSP integration.Ba, Traces in which the EPL stimulation occurred at the peak (considered as φ = 0) or the trough (φ = π) of the oscillations. Bb, Superimposition of four sweeps differing by π/2. Note the constant timing for spike initiation (spikes are truncated). Inset, Expanded view of these traces illustrating the initial EPSPs. Bc, Relationship between the delay for spike initiation and the phase of the stimulation for this cell (open circles) and averaged data ± SEM (filled circles) plotted with a linear regression (r = 0.91; black line).C, Summary graph (n = 5 cells) in which the averaged delay is plotted as a function of the oscillations phase, with corresponding SD (filled circles). Dashed line, Delay corresponding to a spike occurring at the peak of one oscillation. Open circle, Spike latency for identical holding potentials without induced oscillations (DC current). Note that for phases exceeding π the spike latency variability (quantified by the SD) is smaller in the presence of oscillations than in their absence (see Materials and Methods for more details).
Fig. 9.
Fig. 9.
Electrical membrane properties of mitral cells in response to olfactory nerve stimulation. A, Pharmacology of olfactory nerve (O.N.)-induced EPSPs.a, Averaged traces recorded in standard medium (STD), in presence of 100 μm APV (APV), and 10 mm kynurenate (Kyn). b, Histograms showing the effect of APV on O.N.-evoked synaptic responses. Note that APV had small effects on EPSP amplitude (left) but consistently reduced the decay time (right). B,Subthreshold oscillations occur after O.N. stimulation without current injection. Ba, Two representative synaptic responses evoked by O.N. stimulations (arrowheads) illustrate the coexistence of action potentials with subthreshold oscillatory activity. Insets zoom on the induced subthreshold oscillations (left) and a rebound spike triggered by an IPSP (noted by an asterisk on right); Calibration: 25 msec, 2.5 mV. Bb, Injection of a somatic current recorded in presence of kynurenate (10 mm) with bicuculline (40 μm) mimicking O.N.-evoked response. Note the subthreshold oscillation (inset, same scale as inBa) and the rebound spike induced by a short hyperpolarization current pulse (open arrowhead).
Fig. 10.
Fig. 10.
Proposed models for synchronization involving mitral cell intrinsic oscillations and synaptic inputs. These models require a single granule cell impinging on at least two mitral cells.A, Synchronization of subthreshold oscillations can result from two IPSPs in distinct mitral cells coming from the same granule cell. B, The synchronized oscillations can then act as a timing device for EPSP integration, thus allowing synchronization of mitral cell firing. C, For different membrane potentials, IPSPs can trigger rebound spikes with similar timing in two or more distinct mitral cells.

References

    1. Adrian ED. Olfactory reactions in the brain of the hedgehog. J Physiol (Lond) 1942;100:459–473. - PMC - PubMed
    1. Alonso A, Llinás RR. Subthreshold Na+-dependent theta-like rhythmicity in stellate cells of entorhinal cortex layer II. Nature. 1989;342:175–177. - PubMed
    1. Amitai Y. Membrane potential oscillations underlying firing patterns in neocortical neurons. Neuroscience. 1994;63:151–161. - PubMed
    1. Bhalla US, Bower JM. Multiday recordings from olfactory bulb neurons in awake freely moving rats: spatially and temporally organized variability in odorant response properties. J Comput Neurosci. 1997;4:221–256. - PubMed
    1. Buzsaki G, Chrobak JJ. Temporal structure in spatially organized neuronal ensembles: a role for interneuronal networks. Curr Opin Neurobiol. 1995;5:504–510. - PubMed

Publication types

LinkOut - more resources