. 1999 Dec 15;19(24):10738-46.
doi: 10.1523/JNEUROSCI.19-24-10738.1999.

Sustained plateau activity precedes and can generate ictal-like discharges in low-Cl(-) medium in slices from rat piriform cortex

Affiliations

Sustained plateau activity precedes and can generate ictal-like discharges in low-Cl(-) medium in slices from rat piriform cortex

R Demir et al. J Neurosci. .

Abstract

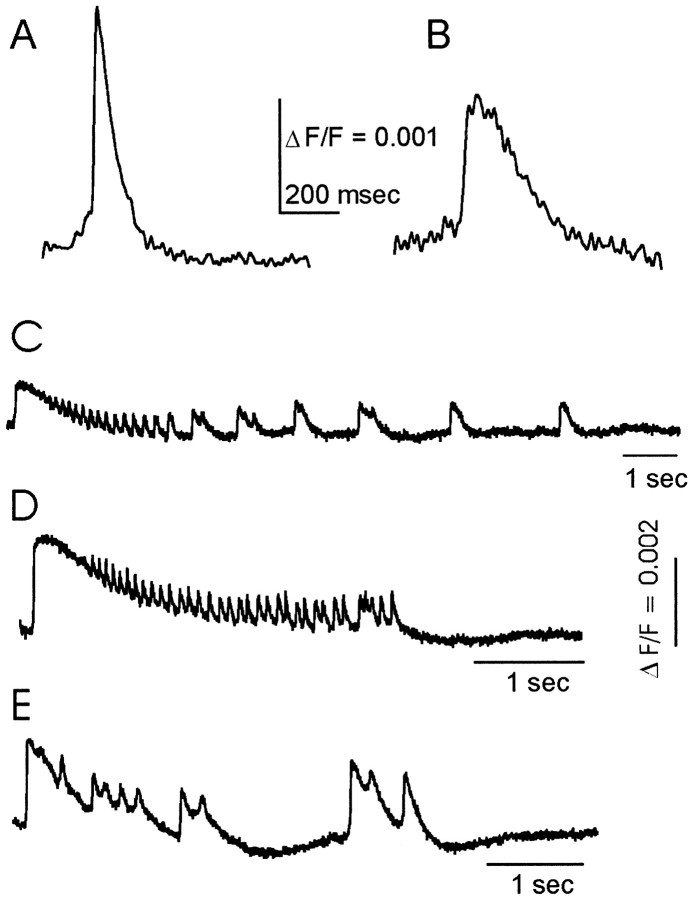
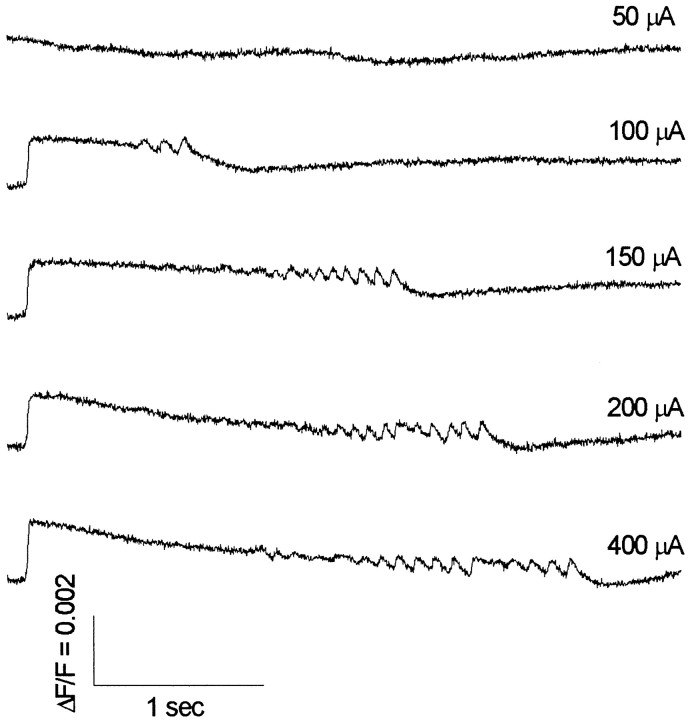
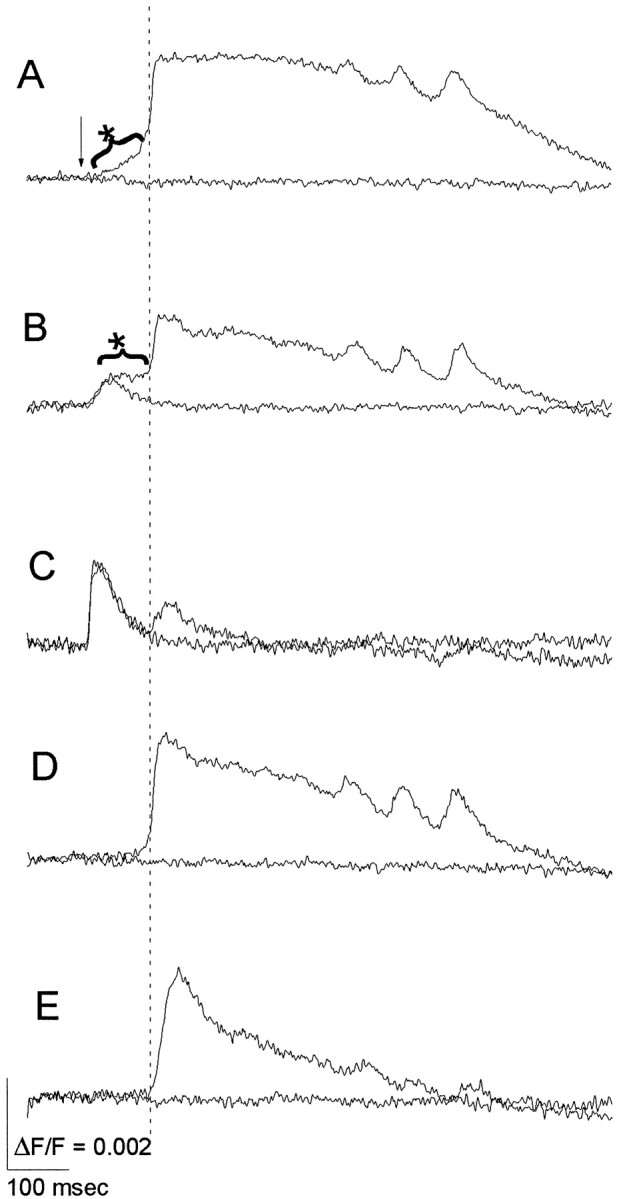
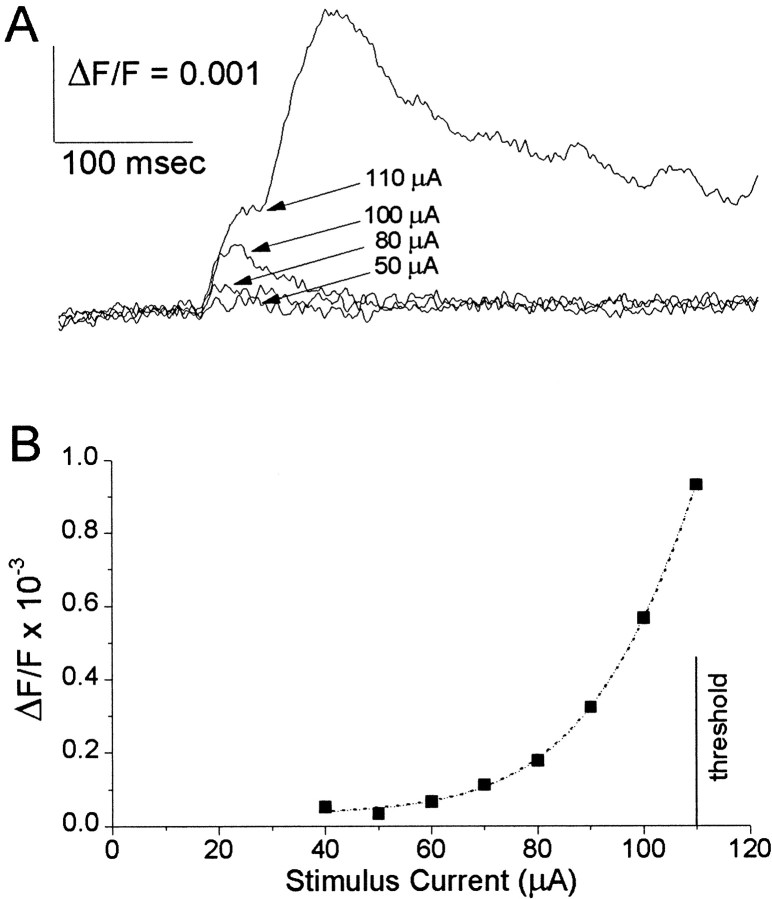
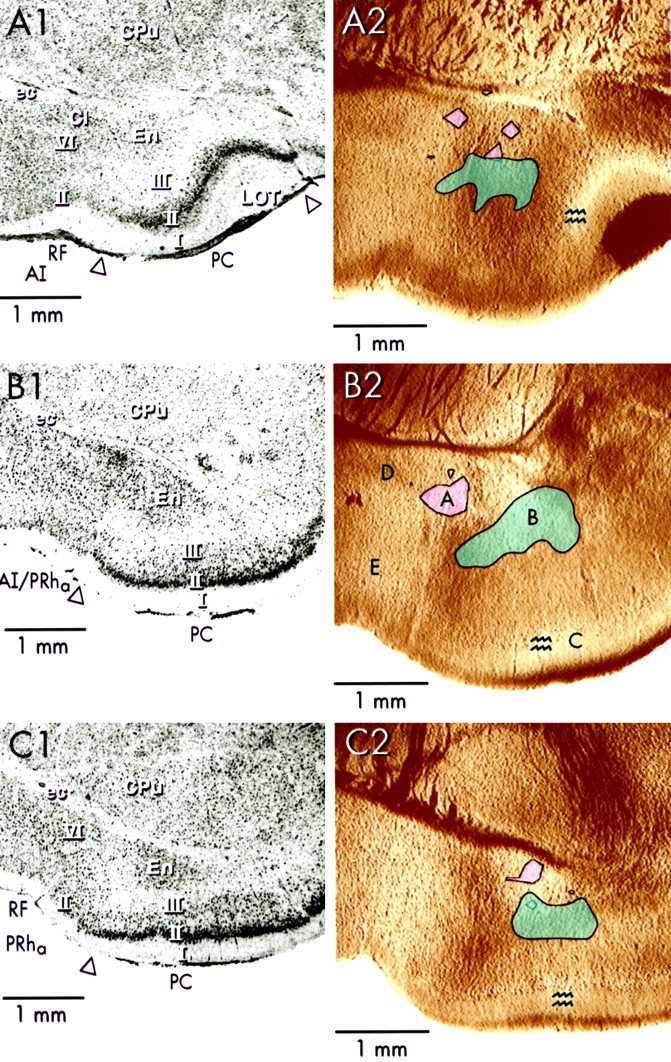
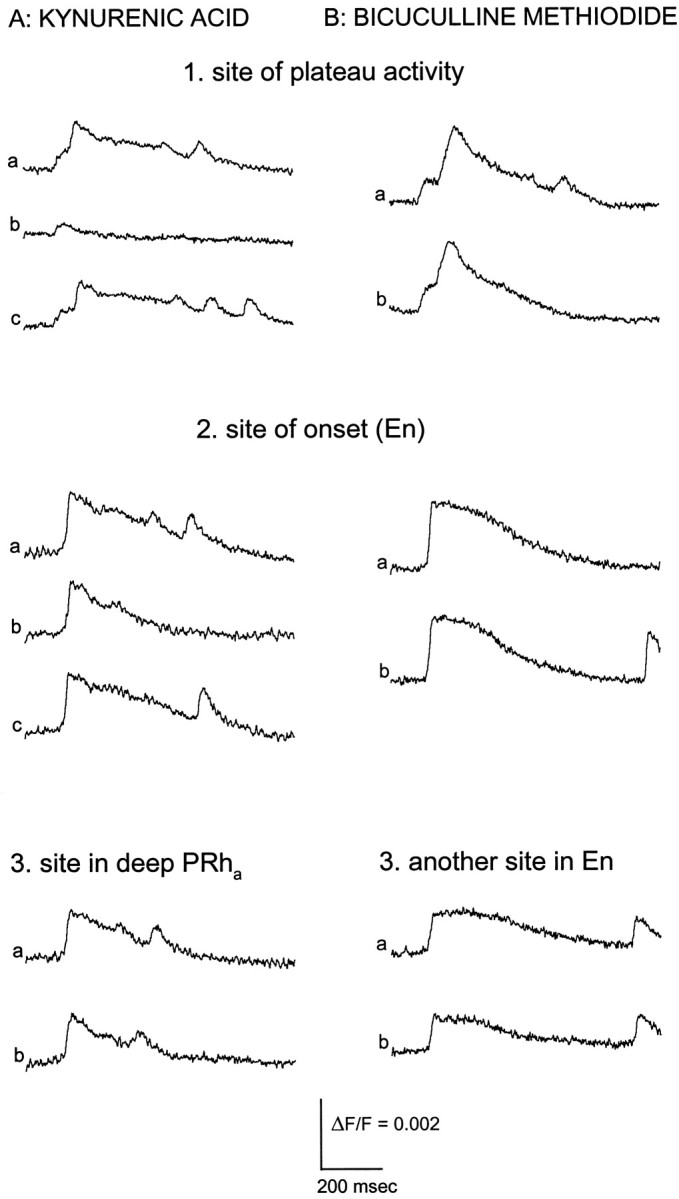
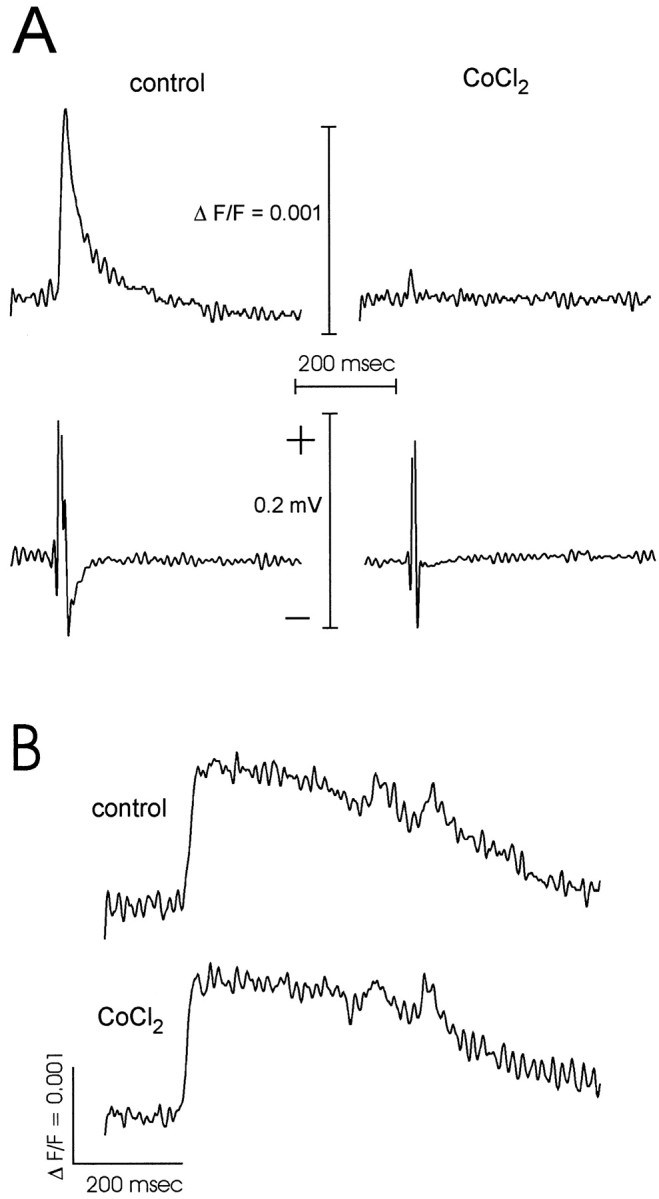
Interictal and ictal discharges represent two different forms of abnormal brain activity associated with epilepsy. Ictal discharges closely parallel seizure activity, but depending on the form of epilepsy, interictal discharges may or may not be correlated with the frequency, severity, and location of seizures. Recent voltage-imaging studies in slices of piriform cortex indicated that interictal-like discharges are generated in a two-stage process. The first stage consists of a sustained, low-amplitude depolarization (plateau activity) lasting the entire latent period prior to discharge onset. Plateau activity takes place at a site distinct from the site of discharge onset and serves to sustain and amplify activity initiated by an electrical stimulus. In the second stage a rapidly accelerating depolarization begins at the onset site and then spreads over a wide region. Here, we asked whether ictal-like discharges can be generated in a similar two-stage process. As with interictal-like activity, the first sign of an impending ictal-like discharge is a sustained depolarization with a plateau-like time course. The rapidly accelerating depolarization that signals the start of the actual discharge develops later at a separate onset site. As found previously with interictal-like discharges, local application of kynurenic acid to the plateau site blocked ictal-like discharges throughout the entire slice. However, in marked contrast to interictal-like activity, blockade of synaptic transmission at the onset site failed to block the ictal-like discharge. This indicates that interictal- and ictal-like discharges share a common pathway in the earliest stage of their generation and that their mechanisms subsequently diverge.


Figures

Fig. 1.
Fig. 1.
Optical recordings of interictal- and ictal-like discharges. A, B, Interictal-like discharge in an induced slice (A; previous bursting in low-Cl ACSF) and a disinhibited slice (B; with 10 μm bicuculline).C–E, Ictal-like discharges in anterior (C), intermediate (D), and posterior (E) PC slices. All fluorescence (F) traces represent averages of six neighboring detectors. Note that the instrumentation uses a high-pass filter with a 500 msec time constant (see Materials and Methods), and this produces some attenuation of the longer events ofC–E. Stimulus was applied to layer Ib of the PC in alltraces; stimulus currents were 175 μA (A), 65 μA (B), 250 μA (C), 275 μA (D), and 60 μA (E).
Fig. 2.
Fig. 2.
Fluorescence traces show responses from En in an intermediate PC slice elicited by increasing stimulus currents (indicated above the traces on the right) applied in layer Ib. The duration of ictal-like discharges increased with increasing stimulus current.Traces represent averages of six neighboring detectors.
Fig. 3.
Fig. 3.
Plateau activity preceding ictal-like discharges. Sub- and suprathreshold responses are superimposed to illustrate the all-or-none character of ictal-like discharges. The time scales are expanded relative to those in Figures 1 and 2 to show the early events before discharge onset. A, A trace from the site of onset shows onset activity (asterisk–curved bracket), characterized by a ramp-like depolarization leading up to a discharge. B, A trace from the site of plateau activity shows plateau activity (asterisk–curved bracket), characterized by a low-amplitude, maintained depolarization. C, Atrace from superficial layer III of the PC is close enough to the site of stimulation to show a rapidly decaying local response. D, E, Responses from deep (D) and superficial (E) layers of the neighboring transitional neocortex between AI and PRha show the ictal-like discharge emerging suddenly from a flat baseline. The discharges in B–E appear after a delay relative to the discharge in the site of onset (A). The verticaldashedline helps to view latency differences. These traces were taken from sites labeledA–E in a subsequent figure (see Fig.5B2). Electrical stimulation (135 μA) was applied in layer Ib at the time indicated by the arrow inA (see Fig. 5B2 for site). Alltraces represent averages of four neighboring detectors.
Fig. 4.
Fig. 4.
Subthreshold responses at the site of plateau activity. A, Superimposed fluorescencetraces are shown from the site of plateau activity in response to increasing stimulus intensities. Responses were evoked by stimulation in layer Ib with the indicated current.Traces represent averages of seven neighboring detectors. Note that the subthreshold responses were not flat like plateau activity but decayed immediately after peaking. Note further that the amplitude does not increase linearly with increasing stimulus intensities. B, A stimulus–response plot illustrates this nonlinearity more clearly. The peak response amplitudes fromA were plotted versus stimulus current. The nonlinearity is emphasized by a sigmoidal fit.
Fig. 5.
Fig. 5.
Site of plateau activity associated with ictal-like discharges. Nissl-stained photographs (A1–C1) were taken from the same slices shown inA2–C2. Sites of discharge onset (pinkshading) and plateau activity (blueshading) are indicated on video images from anterior (A1, A2), intermediate (B1, B2), and posterior (C1, C2) PC slices. Stimulus sites are indicated by paralleljaggedlines in A2–C2. Stimulus currents were 100 μA (A1, A2), 135 μA (B1, B2), and 63 μA (C1, C2).AI, Agranular insula; Cl, claustrum;CPu, caudate-putamen; ec, external capsule; En, endopiriform nucleus; LOT,lateral olfactory tract; PC, piriform cortex;PRha, anterior perirhinal cortex;RF, rhinal fissure. Open arrowheads mark the PC/neocortex boundary.
Fig. 6.
Fig. 6.
Blockade of ictal-like activity. A, Kynurenic acid (5 mm) was locally applied at several sites to determine the role of excitatory synaptic transmission in the generation of ictal-like discharges. Traces inA1 show responses from the site of plateau activity in an intermediate PC slice before (A1a), immediately after (A1b), and a few minutes after (A1c) kynurenic acid application. The ictal-like discharge was blocked by kynurenic acid application at this site (A1b) and recovered completely after washout (A1c). When kynurenic acid was applied at the site of onset, ictal-like activity (A2a) was not blocked, although the response was usually attenuated locally (A2b) and recovered to full size after a few minutes (A2c). Application of kynurenic acid at a site in deep AI/PRha(A3) did not block the ictal-like discharge.B, Bicuculline methiodide (50 μm) was applied to several sites to test whether reversed inhibitory potentials play a role in the generation of ictal-like discharges. Local application of bicuculline at the site of plateau activity (B1a,b), the site of onset (B2a,b), and another site in En (B3a,b) did not block ictal-like activity. Traces in A andB were taken from two different slices and show responses from the sites of drug application (indicatedabove each set of traces).Traces are averages of four neighboring detectors. Ictal-like discharges were evoked by stimulation in layer Ib at 140 μA (A1), 110 μA (A2), 95 μA (A3), 67 μA (B1), 55 μA (B2), and 52.5 μA (B3).
Fig. 7.
Fig. 7.
Effects of CoCl2 on synaptic transmission and ictal-like discharges. A, Fluorescence (top) and extracellular field potentials (bottom) were recorded from En in a control slice. Responses evoked by 400 μA applied in deep layer III of the PC were almost completely abolished by bath application of 2 mmCoCl2. (KH2PO4 was omitted from the ACSF for both control and CoCl2). Eachtrace represents an average of signals from six neighboring detectors averaged over 10 trials. B,Fluorescence traces from the En show an ictal-like discharge evoked by a stimulus of 47 μA applied in layer Ib.Traces show discharges before (top) and immediately after (bottom) application of 10 mm CoCl2 and 50 μm bicuculline to the site of discharge onset.

Similar articles

Cited by

References

    1. Ayala GF, Matsumoto H, Gumnit RJ. Excitability changes and inhibitory mechanisms in neocortical neurons during seizures. J Neurophysiol. 1970;33:73–85. - PubMed
    1. Chamberlin NL, Dingledine R. GABAergic inhibition and the induction of spontaneous epileptiform activity by low chloride and high potassium in the hippocampal slice. Brain Res. 1988;445:12–18. - PubMed
    1. Chien C-B, Pine J. Voltage-sensitive dye recording of action potentials and synaptic potentials from sympathetic microcultures. Biophys J. 1991;60:697–711. - PMC - PubMed
    1. Demir R, Haberly LB, Jackson MB. Voltage imaging of epileptiform activity in slices from rat piriform cortex: onset and propagation. J Neurophysiol. 1998;80:2727–2742. - PubMed
    1. Demir R, Haberly LB, Jackson MB. Sustained and accelerating activity at two discrete sites generate epileptiform discharges in slices of piriform cortex. J Neurosci. 1999;19:1294–1306. - PMC - PubMed

Publication types