

Thrombin-induced growth cone collapse: involvement of phospholipase A(2) and eicosanoid generation
- PMID: 10594066
- PMCID: PMC6784923
- DOI: 10.1523/JNEUROSCI.19-24-10843.1999
Thrombin-induced growth cone collapse: involvement of phospholipase A(2) and eicosanoid generation
Abstract
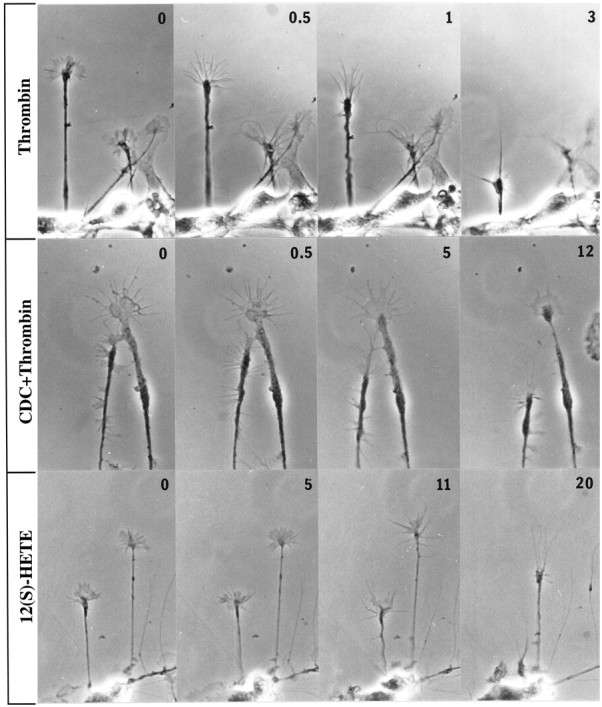
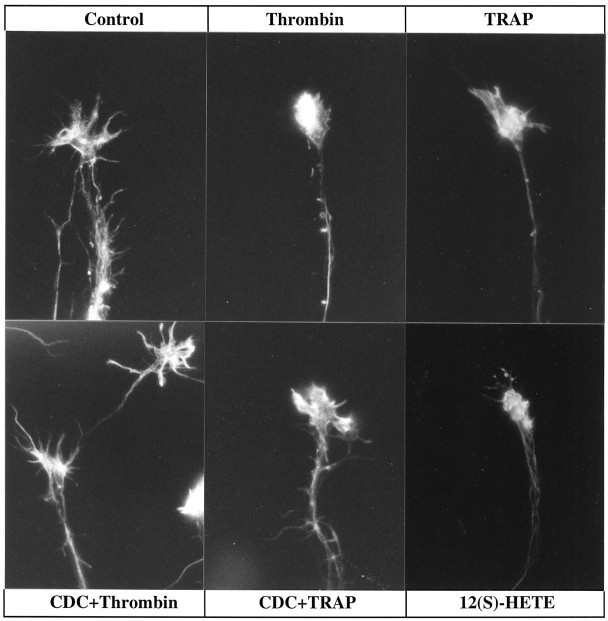
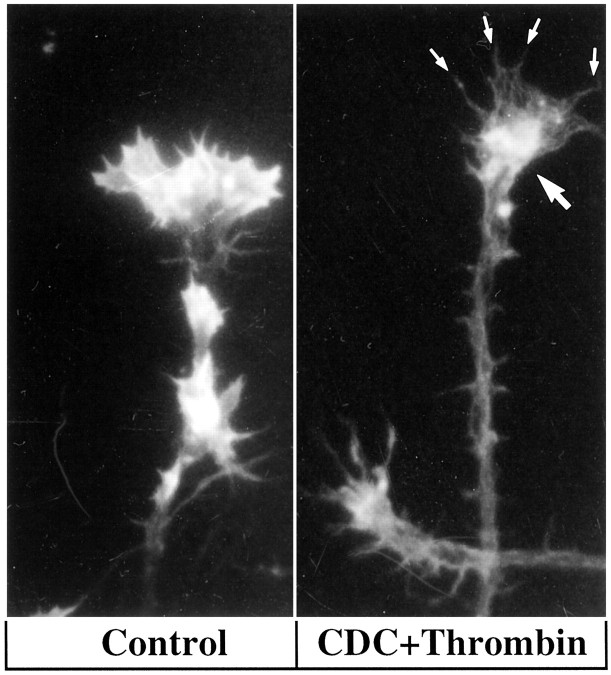
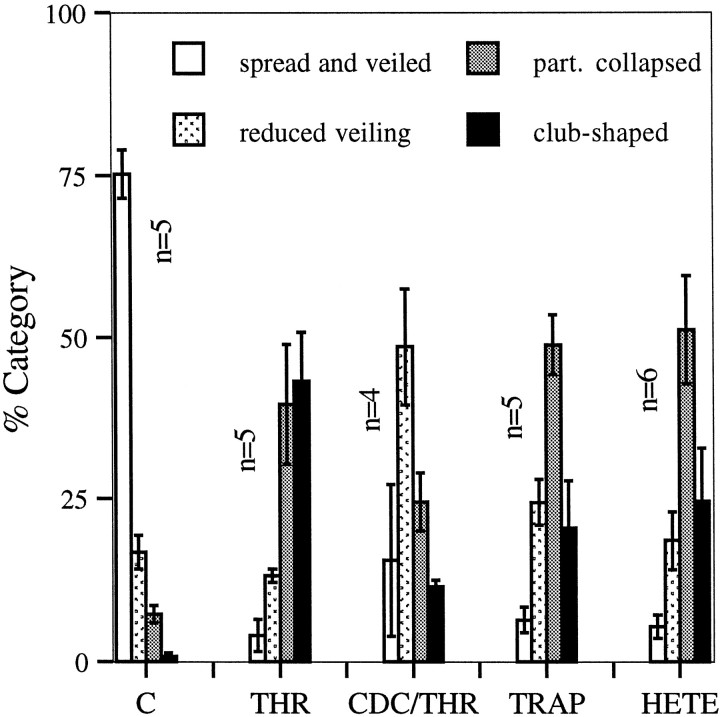
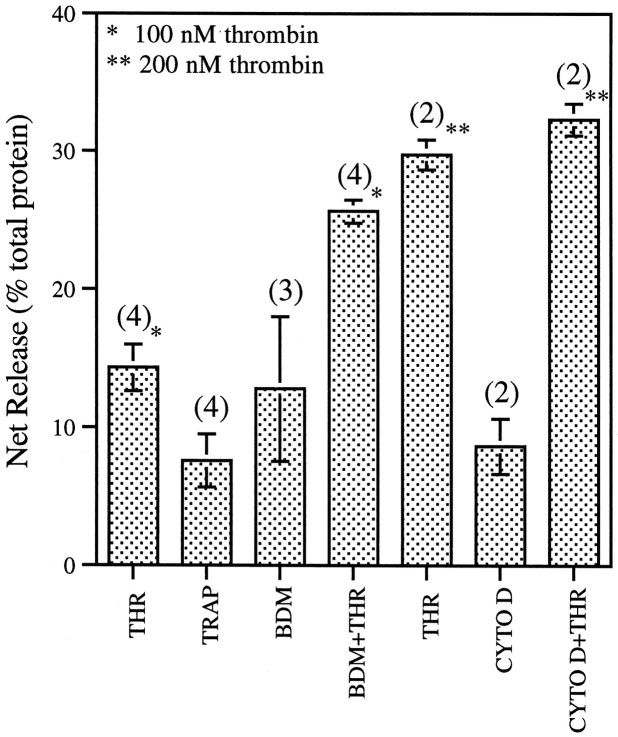
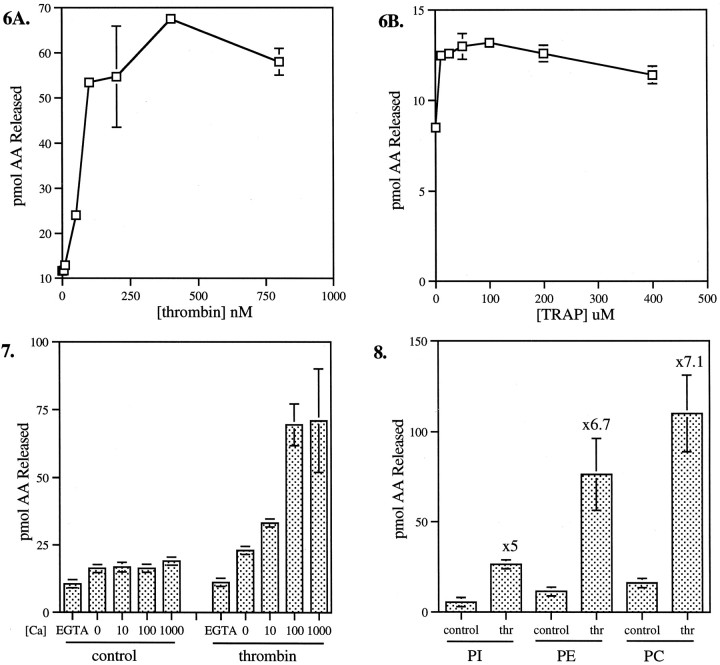
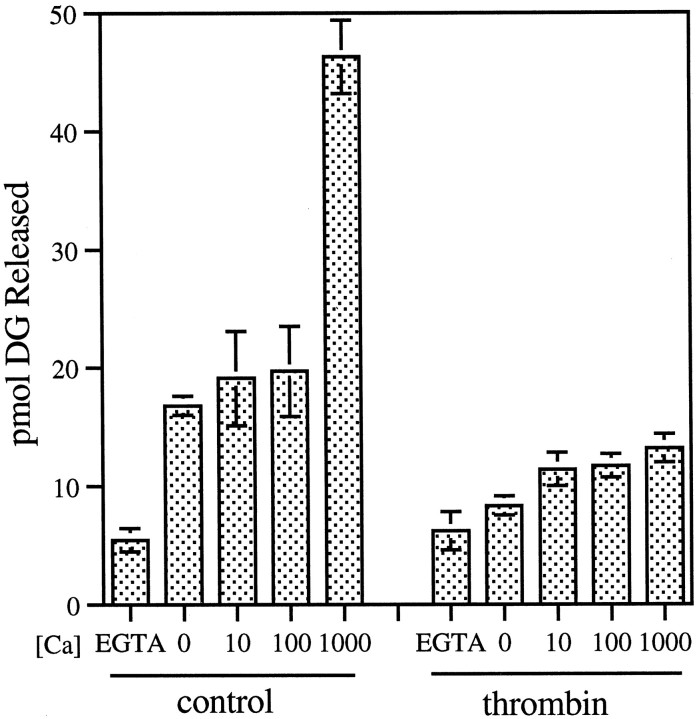
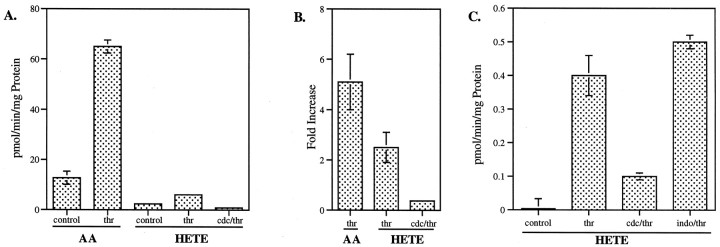
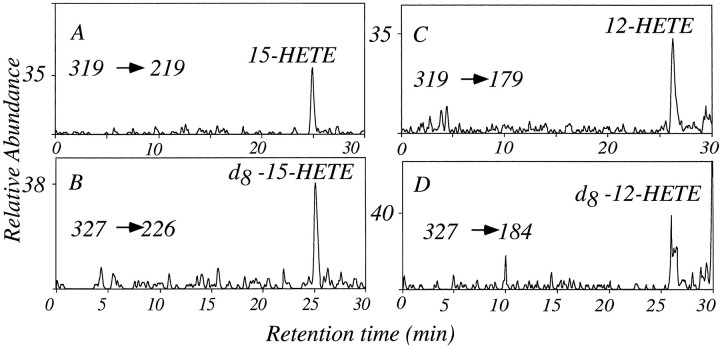
The studies presented here explore intracellular signals resulting from the action of repellents on growth cones. Growth cone challenge with thrombin or thrombin receptor-activating peptide (TRAP) triggers collapse via a receptor-mediated process. The results indicate that this involves activation of cytosolic phospholipase A(2) (PLA(2)) and eicosanoid synthesis. The collapse response to repellents targets at least two functional units of the growth cone, the actin cytoskeleton and substratum adhesion sites. We show in a cell-free assay that thrombin and TRAP cause the detachment of isolated growth cones from laminin. Biochemical analyses of isolated growth cones reveal that thrombin and TRAP stimulate cytosolic PLA(2) but not phospholipase C. In addition, thrombin stimulates synthesis of 12- and 15-hydroxyeicosatetraenoic acid (HETE) from the released arachidonic acid via a lipoxygenase (LO) pathway. A selective LO inhibitor blocks 12/15-HETE synthesis in growth cones and inhibits thrombin-induced growth cone collapse. Exogenously applied 12(S)-HETE mimics the thrombin effect and induces growth cone collapse in culture. These observations indicate that thrombin-induced growth cone collapse occurs by a mechanism that involves the activation of cytosolic PLA(2) and the generation of 12/15-HETE.
Figures
Similar articles
-
Growth cone collapse induced by semaphorin 3A requires 12/15-lipoxygenase.J Neurosci. 2002 Jun 15;22(12):4932-41. doi: 10.1523/JNEUROSCI.22-12-04932.2002. J Neurosci. 2002. PMID: 12077190 Free PMC article.
-
Eicosanoid activation of protein kinase C epsilon: involvement in growth cone repellent signaling.J Biol Chem. 2003 Jun 6;278(23):21168-77. doi: 10.1074/jbc.M211828200. Epub 2003 Mar 28. J Biol Chem. 2003. PMID: 12665507
-
Thrombin causes pseudopod detachment via a pathway involving cytosolic phospholipase A2 and 12/15-lipoxygenase products.Cell Growth Differ. 2000 Jan;11(1):19-30. Cell Growth Differ. 2000. PMID: 10672900
-
Key Role of 12-Lipoxygenase and Its Metabolite 12-Hydroxyeicosatetraenoic Acid (12-HETE) in Diabetic Retinopathy.Curr Eye Res. 2022 Mar;47(3):329-335. doi: 10.1080/02713683.2021.1995003. Epub 2022 Feb 7. Curr Eye Res. 2022. PMID: 35129022 Review.
-
Eicosanoid regulation of angiogenesis in human prostate carcinoma and its therapeutic implications.Ann N Y Acad Sci. 2000 Apr;905:165-76. doi: 10.1111/j.1749-6632.2000.tb06548.x. Ann N Y Acad Sci. 2000. PMID: 10818452 Review.
Cited by
-
Myristoylated, alanine-rich C-kinase substrate phosphorylation regulates growth cone adhesion and pathfinding.Mol Biol Cell. 2006 Dec;17(12):5115-30. doi: 10.1091/mbc.e05-12-1183. Epub 2006 Sep 20. Mol Biol Cell. 2006. PMID: 16987960 Free PMC article.
-
Group IVA phospholipase A₂ is necessary for growth cone repulsion and collapse.J Neurochem. 2012 Mar;120(6):974-84. doi: 10.1111/j.1471-4159.2012.07651.x. Epub 2012 Feb 6. J Neurochem. 2012. PMID: 22220903 Free PMC article.
-
The extended cleavage specificity of human thrombin.PLoS One. 2012;7(2):e31756. doi: 10.1371/journal.pone.0031756. Epub 2012 Feb 27. PLoS One. 2012. PMID: 22384068 Free PMC article.
-
Contribution of extracellular proteolysis and microglia to intracerebral hemorrhage.Neurocrit Care. 2005;3(1):77-85. doi: 10.1385/NCC:3:1:077. Neurocrit Care. 2005. PMID: 16159103 Review.
-
Munc18 and Munc13 regulate early neurite outgrowth.Biol Cell. 2010 Jun 30;102(8):479-88. doi: 10.1042/BC20100036. Biol Cell. 2010. PMID: 20497124 Free PMC article.
References
-
- Bar-Sagi D. Phospholipase A2 in ras-transformed cells. In: Dennis EA, Hunter T, Berridge M, editors. Cell activation and signal initiation: receptor and phospholipase control of inositol phosphate, PAF, and eicosanoid production. Liss; New York: 1989. pp. 331–335.
-
- Bar-Sagi D, Feramisco JR. Induction of membrane ruffling and fluid-phase pinocytosis in quiescent fibroblasts by ras proteins. Science. 1986;233:1061–1068. - PubMed
-
- Birkle DL, Bazan EP, Bazan NG. Analysis of prostaglandins, leukotrienes, and related compounds in retina and brain. In: Boulton AA, Baker GB, Horrocks LA, editors. Neuromethods, Vol 7. Humana; Totowa: NJ: 1988. pp. 227–244.
-
- Bligh EG, Dyer WJ. A rapid method of total lipid extraction and purification. Can J Biochem Physiol. 1959;37:911–917. - PubMed
-
- Bradford MM. A rapid and sensitive method for the quantification of microgram quantities of protein utilizing the principle of protein-dye binding. Anal Biochem. 1976;72:248–254. - PubMed
Publication types
MeSH terms
Substances
Grants and funding
LinkOut - more resources
Full Text Sources
Other Literature Sources