. 1999 Dec 15;19(24):10856-68.
doi: 10.1523/JNEUROSCI.19-24-10856.1999.

Involvement of cajal-retzius neurons in spontaneous correlated activity of embryonic and postnatal layer 1 from wild-type and reeler mice

Affiliations

Involvement of cajal-retzius neurons in spontaneous correlated activity of embryonic and postnatal layer 1 from wild-type and reeler mice

A Aguiló et al. J Neurosci. .

Abstract

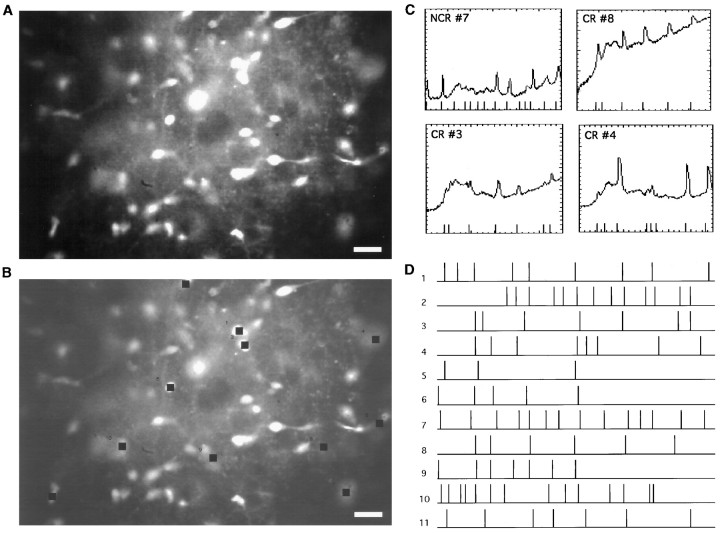
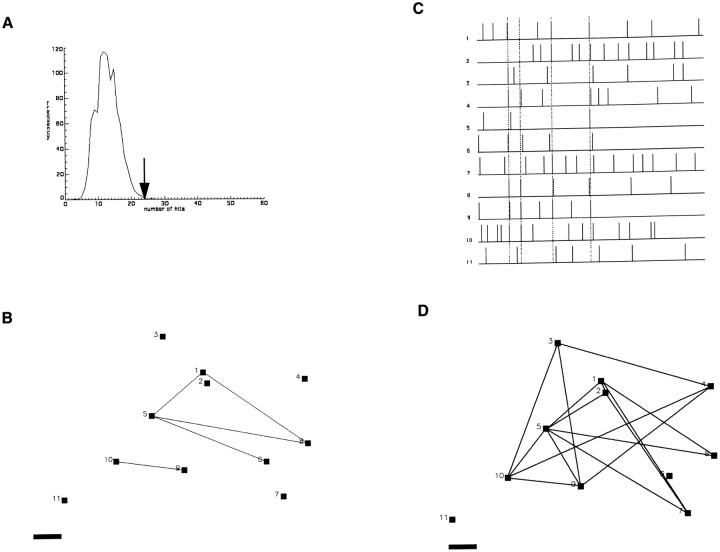
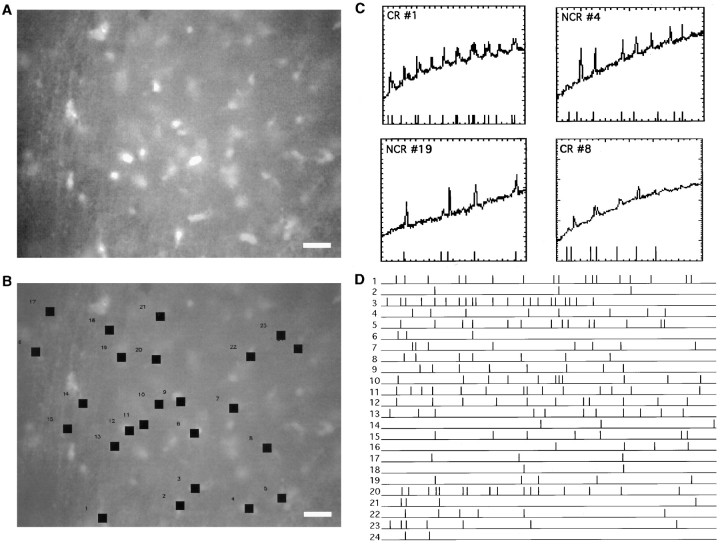
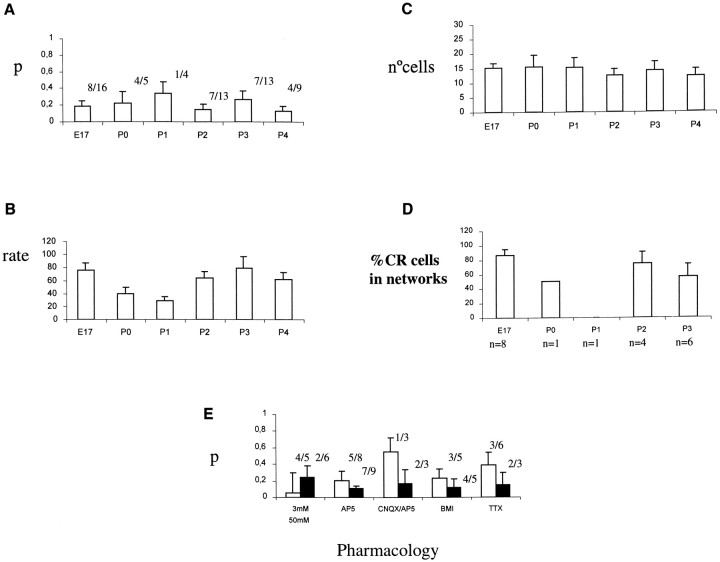
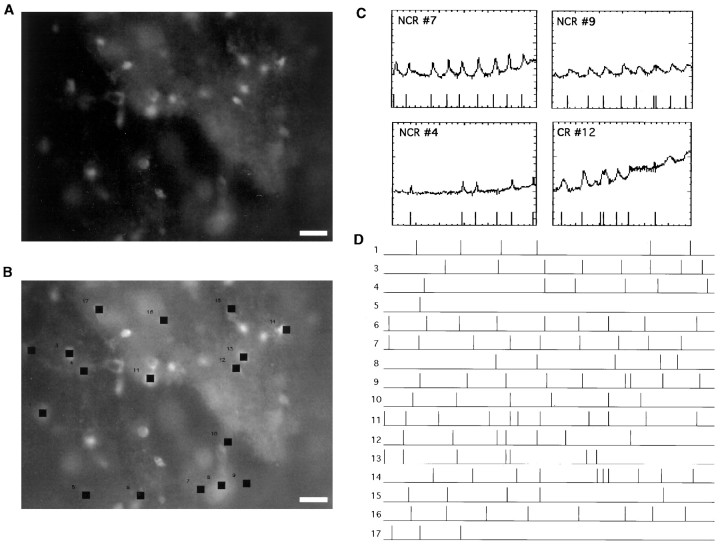
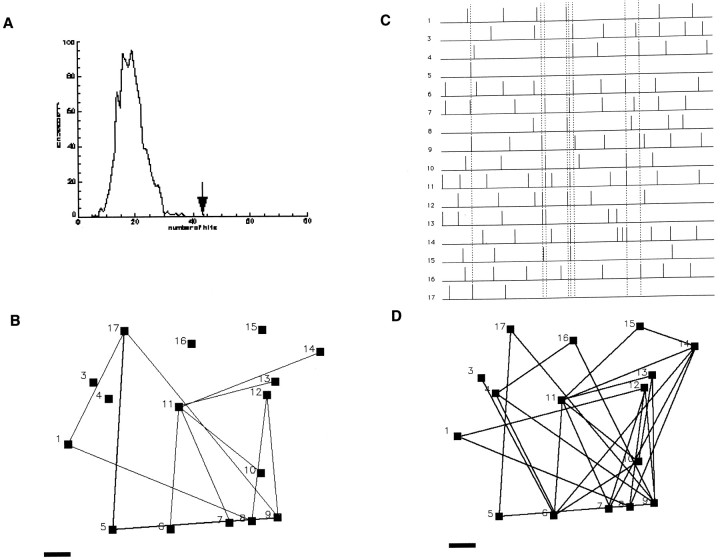
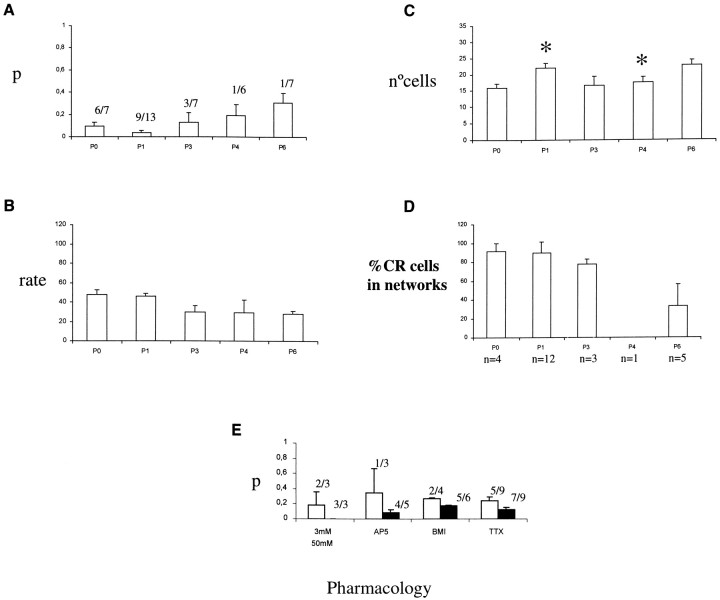
Cajal-Retzius (CR) cells are a transient population of neurons in developing cortical layer 1 that secrete reelin, a protein necessary for cortical lamination. Combining calcium imaging of cortical hemispheres and cross-correlation analysis, we previously found spontaneous correlated activity among non-CR neurons in postnatal rat layer 1. This correlated activity was blocked by GABAergic and glutamatergic antagonists, and we postulated that it was controlled by CR cells. We now investigate the correlated activity of embryonic and postnatal layer 1 in wild-type and reeler mice, mutant in the production of reelin. We find that mouse layer 1 also sustains patterned spontaneous activity and that CR cells participate in correlated networks. These networks are present in embryonic marginal zone and are blocked by GABAergic and glutamatergic antagonists. Surprisingly, network activity in reeler mice displays similar characteristics and pharmacological profile as in wild-type mice, although small differences are detected. Our results demonstrate that the embryonic marginal zone has correlated spontaneous activity that could serve as the scaffold for the development of intracortical connections. Our data also suggest that reelin does not have a major impact in the development of specific synaptic circuits in layer 1.


Figures

Fig. 1.
Fig. 1.
Fura-2 loading of CR and non-CR neurons in mouse layer 1. A, DIC image of a tangential brain slice from a P1 mouse cortex. The slice is viewed from its pial surface after the pia has been removed. Several CR neurons (numbers) can be distinguished by their long dendritic process. Putative non-CR cells (letters) lack any major process. Scale bar, 20 μm.B, Fluorescence image of the same region after staining with fura-2 AM. Note how both CR and putative NCR neurons are labeled by the indicator. C, Photomicrograph of a processed coronal slice containing a biocytin-filled CR cell. The major horizontal process can be distinguished. Scale bar, 50 μm.D, Camera lucida reconstruction of neuron shown inC. The layer 1 border is drawn with a stippled line. Scale bar, 100 μm.
Fig. 2.
Fig. 2.
Spontaneous calcium transients in wild-type layer 1 show complex spatiotemporal patterns. A, Fluorescence image of a cortical hemisphere from a P3 mouse loaded with fura-2 AM. Many labeled neurons are visible. Scale bar, 20 μm. B, Cells chosen for the analysis. Black squares indicate cells exhibiting transients. Neurons 3, 4, and 8 were identified as Cajal-Retzius. C, Plots of −ΔF/F over time measured in four representative cells during spontaneous activity. Each fluorescence transient is marked with a time stamp (lines) seen atbottom of graph (see Materials and Methods). Note that the program successfully detects all calcium transients. Time axis, 01200 sec; −ΔF/F axis, − 520 (percent). D, Composite raster plot of all cells chosen in B indicating the onset of each calcium transient as displayed in C. Each linerepresents a cell, and each tick mark represents the time of onset of a calcium transient. Note that the spontaneous activity does not follow any clear pattern, although correlated activation of two or more cells can be detected. Duration, 600 sec.
Fig. 3.
Fig. 3.
Networks of CR and NCR cells in wild-type layer 1.A, Distribution of pairwise correlations (“hits”) found in the real (arrow) and simulated (line) data set from Figure 2. The number of correlated events in the real data set is greater than those obtained in 1000 Monte Carlo simulations (bell-shaped curve; see Materials and Methods).B, Correlation map of cells imaged in Figure 2. Eachblack square represents an active cell.Lines link cells with a statistically significant correlation coefficients (see Materials and Methods). C, Raster plot of the experiment showing which neurons fire simultaneously in groups (dotted lines). D, Correlation map based on the groups of cells firing simultaneously inC. Note how the coactive groups cover the same cortical territory. Note also how CR cells 3, 4, and 8 are correlated with both CR and NCR cells. Scale bar, 10 μm.
Fig. 4.
Fig. 4.
Imaging spontaneous activity in embryonic layer 1.A, Fluorescence image of a cortical hemisphere from an E18 mouse loaded with fura-2 AM. Many labeled neurons are visible. Scale bar, 20 μm. B, Cells analyzed. Neurons 1, 2, 3, 6, and 8 were identified as Cajal-Retzius. C, Plots of −ΔF/F over time measured in four representative cells during spontaneous activity. Again, the onset of each fluorescence transient is marked with a time stamp seen at thebottom of graph (see Materials and Methods). Time axis, 01200 sec; −ΔF/F axis, − 520 (percent) for cells 1, 4, and 19; − 1050(percent) for cell 8. D, Composite raster plot of all cells chosen in B. Duration, 600 sec.
Fig. 5.
Fig. 5.
Networks of CR and NCR cells in embryonic layer 1.A, Distribution of pairwise correlations found in the real (arrow) and simulated data set from Figure 4.B, Correlation map of cells imaged in Figure 4.C, Raster plot of the experiment highlighting groups of coactive neurons (lines). D, Correlation map based on the groups of cells firing simultaneously inC. Note how CR cells 1, 2, 3, 6, and 8 are correlated with both CR and NCR cells. Scale bar, 10 μm.
Fig. 6.
Fig. 6.
Quantification of the spontaneous activity in wild-type hemispheres and pharmacological blockade of the networks.A, Histogram of the degree of correlation (as measured by the p statistic; see Materials and Methods) as a function of age. A lower p indicates a high degree of pairwise correlation. The bars represent the mean p, and the error bars represent the SE. The fraction represents the number of experiments that had significant (p < 0.05) correlations, divided by the total number of experiments. B, Histogram of the activation rate (number of transients/cell/104 sec) as a function of age. The total number of experiments as inA. C, Histogram of the number of active cells as a function of age. D, Histogram of the percentage of the active CR cells that form part of a network, divided by the total number of CR cells. For each age, the number of experiments in which active CR were identified is givenbelow the histogram. E, Pharmacological effects on the networks. Histogram of the average pvalue (as above) under 3 and 50 mm K+ACSF, AP-5 (50 μm), AP-5–CNQX (50–20 μm), BMI (30 μm), and TTX (1 μm). White bars are the mean p value under each test, andblack bars represent control experiments using 50 mm K+ ACSF. The fractionrepresents the number of experiments that had significant (p < 0.05) correlations, divided by the total number of experiments. Note how AP-5, CNQX–AP-5, BMI, and TTX increase the average p value (i.e., decorrelate the networks).
Fig. 7.
Fig. 7.
Spontaneous calcium transients in reeler layer 1.A, Fluorescence image of a cortical hemisphere from a P3 reeler mouse loaded with fura-2 AM. Scale bar, 20 μm.B, Cells chosen for the analysis. Cell 12 was identified as a CR. C, Plots of −ΔF/F over time measured in four representative cells during spontaneous activity. Time axis, 01200 sec; −ΔF/F axis, − 510 (percent). D, Composite raster plot of all cells chosen. Note that the spontaneous activity also does not follow any clear pattern, although correlated activation of two or more cells can be detected. Duration, 1200 sec.
Fig. 8.
Fig. 8.
Networks of CR and NCR cells in reeler layer 1.A, Distribution of pairwise correlations found in the real (arrow) and simulated data set from Figure 7. The number of correlated events in the real data set is higher than the tail of the gaussian distribution obtained with 1000 Monte Carlo simulations (see Materials and Methods). B, Correlation map of cells imaged in Figure 7. C, Raster plot of an experiment marking groups of cells that fire simultaneously (dotted lines). D, Correlation map based on the groups of cells firing simultaneously in C. Note how CR cell 12 is correlated with NCR cells. Scale bar, 10 μm.
Fig. 9.
Fig. 9.
Quantification of the spontaneous activity in reeler and pharmacological blockade of the networks. Same convention as in Figure 4. A, Histogram of the degree of correlation as a function of age. Note how the networks become more decorrelated with increasing age. B, Histogram of the activation rate as a function of age. C, Histogram of the number of active cells as a function of age. Asterisks mark ages that are statistically significantly larger (p > 0.05) than wild-type hemisphere (see Fig. 6C). D, Percentage of the active CR cells that form part of a network. E, Pharmacological effects on the reeler networks. Histogram of the averagep value (as above) under 3 mmK+ ACSF, AP-5 (50 μm), BMI (30 μm), and TTX (1 μm). White bars are the mean p value under each test, andblack bars represent control experiments using 50 mm K+ ACSF. Note how, in reeler layer 1, AP-5, BMI, and TTX also increase the average p value (i.e., decorrelate the networks).

Similar articles

Cited by

References

    1. Berridge MJ. Neuronal calcium signaling. Neuron. 1998;21:13–26. - PubMed
    1. Borrell V, Del Río JA, Alcantara S, Derer M, Martinez A, D'Arcangelo G, Nakajima K, Mikoshiba K, Derer P, Curran T, Soriano E. Reelin regulates the development and synaptogenesis of the layer-specific entorhino-hippocampal connections. J Neurosci. 1999;19:1345–1358. - PMC - PubMed
    1. Cauller LJ, Kulics AT. The neural basis of the behaviourally relevant N1 component of the somatosensory-evoked potentials of S1 cortex of awake monkeys: evidence that backward cortical projection signals conscius touch sensation. Exp Brain Res. 1991;84:607–619. - PubMed
    1. Caviness VSJ, Sidman RL. Time of origin of corresponding cell classes in the cerebral cortex of normal and mutant reeler mice: an autoradiographic analysis. J Comp Neurol. 1973;148:141–151. - PubMed
    1. D'Arcangelo G, Miao GG, Chen S-C, Soarse HD, Morgan JI, Curran T. A protein related to extracellular matrix proteins deleted in the mouse mutant reeler. Nature. 1995;374:719–723. - PubMed

Publication types

LinkOut - more resources