. 1999 Dec 15;19(24):10886-97.
doi: 10.1523/JNEUROSCI.19-24-10886.1999.

Neurochemical and cellular reorganization of the spinal cord in a murine model of bone cancer pain

Affiliations

Neurochemical and cellular reorganization of the spinal cord in a murine model of bone cancer pain

M J Schwei et al. J Neurosci. .

Abstract

The cancer-related event that is most disruptive to the cancer patient's quality of life is pain. To begin to define the mechanisms that give rise to cancer pain, we examined the neurochemical changes that occur in the spinal cord and associated dorsal root ganglia in a murine model of bone cancer. Twenty-one days after intramedullary injection of osteolytic sarcoma cells into the femur, there was extensive bone destruction and invasion of the tumor into the periosteum, similar to that found in patients with osteolytic bone cancer. In the spinal cord, ipsilateral to the cancerous bone, there was a massive astrocyte hypertrophy without neuronal loss, an expression of dynorphin and c-Fos protein in neurons in the deep laminae of the dorsal horn. Additionally, normally non-noxious palpation of the bone with cancer induced behaviors indicative of pain, the internalization of the substance P receptor, and c-Fos expression in lamina I neurons. The alterations in the neurochemistry of the spinal cord and the sensitization of primary afferents were positively correlated with the extent of bone destruction and the growth of the tumor. This "neurochemical signature" of bone cancer pain appears unique when compared to changes that occur in persistent inflammatory or neuropathic pain states. Understanding the mechanisms by which the cancer cells induce this neurochemical reorganization may provide insight into peripheral factors that drive spinal cord plasticity and in the development of more effective treatments for cancer pain.


Figures

Fig. 1.
Fig. 1.
Quantification of bone destruction after injection of osteolytic sarcoma cells into the femoral intramedullary space. Hematoxylin–eosin staining of normal (A) and 21 d sarcoma-bearing (B) femora, showing the replacement of the darkly stained marrow cells with the more lightly stained sarcoma cells that have induced bone destruction and grown through the bone (arrowhead) and beyond (arrow). Radiographs of the femur (C) showing the progressive loss of bone caused by tumor growth. Bone destruction was quantified on a 0–3 scale based on the loss of bone. Images 0–3 are examples of each state of destruction: 0, normal bone; 1,minor loss of bone in medullary canal (arrow);2, substantial loss of bone in medullary canal with some destruction of the distal femur (arrow);3, substantial loss of bone in medullary canal with major structural destruction of the distal femur (arrow). Scale bars: A, B, 200 μm;C, 2 mm.
Fig. 2.
Fig. 2.
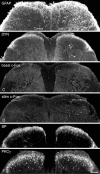
Neurochemical changes in the dorsal horn of the spinal cord 21 d after unilateral injection of an osteolytic sarcoma in the intramedullary space of the femur. Confocal images of coronal sections of the L4 spinal cord illustrate the distribution of the astrocyte marker GFAP (A); DYN witharrows indicating the cell bodies expressing this pro-hyperalgesic peptide (B); c-Fos protein in the basal unstimulated state (C); c-Fos protein at 1 hr after normally non-noxious palpation of the knee (D); SP (E); PKCγ isoform (F). Note that the major changes occur in the spinal cord ipsilateral to the cancer-bearing femur and include an increase in GFAP (A), DYN (B), basal c-Fos expression (C), and increased expression of c-Fos in neurons located in laminae I and II after normally non-noxious palpation (D). In contrast, levels of SP (E), a peptide contained in primary afferent neurons that is frequently upregulated in persistent pain states, and PKCγ (F), a kinase that is expressed in a subset of spinal neurons in lamina II and that is frequently upregulated in neuropathic pain states, remained unchanged. These images are from 60-μm-thick tissue sections projected from 10 optical sections acquired at 5 μm intervals with a 20× lens. Scale bar, 200 μm.
Fig. 3.
Fig. 3.
Confocal images showing the increase in the astrocyte marker GFAP in coronal sections of the L4 spinal cord 21 d after injection of osteolytic sarcoma cells into the intramedullary space of the femur. In A–C, the GFAP is bright orange, and in D and E, GFAP isgreen, and the NeuN staining (which labels neurons) isred. A low-power image (A) shows that the upregulation of GFAP is almost exclusively ipsilateral to the femur with cancer, with a small increase in the contralateral spinal cord in lamina X. Higher magnification of GFAP contralateral (B, D) and ipsilateral (C, E) to the femur with cancer shows that on the ipsilateral side, there is marked hypertrophy of astrocytes characterized by an increase in both the size of the astrocyte cell bodies and the extent of the arborization of their distal processes. Additionally, this increase in GFAP (green) is observed without a detectable loss of neurons, because NeuN (red) labeling remains unchanged (D, E). These images, from 60-μm-thick tissue, are projected from six optical sections acquired at 4 μm intervals with a 20× lens. Scale bars: A, 200 μm (projected from 12 optical sections acquired at 0.8 μm intervals with a 100× lens);B, C, 20 μm (projected from 10 optical sections acquired at 0.8 μm intervals with a 60× lens);D, E, 30 μm.
Fig. 4.
Fig. 4.
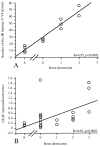
Correlation of bone destruction with spinal cord GFAP immunofluorescence and with basal spinal c-Fos expression. Results are expressed as correlation coefficient (R) between bone destruction as defined in Figure 1 (score 0–3;S, sham) and the number of neurons expressing c-Fos in laminae V-VI (A) and GFAP immunofluorescence in laminae I-X (B). Note that there is a significant correlation between the extent of bone destruction with both basal c-Fos expression and GFAP immunofluorescence.
Fig. 5.
Fig. 5.
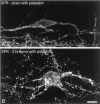
Normally non-noxious palpation of the knee induces SPR internalization in lamina I in animals with osteolytic sarcoma cells injected into the femur but not in sham-injected animals. Confocal images of lamina I SPR neurons in the spinal cord ipsilateral to the sham-injected femur (A) and osteolytic sarcoma cell-injected femur (B). In these photomicrographs the SPR, when internalized, is seen concentrated in bright endosomes inside the cytoplasm. Note that whereas innocuous palpation does not induce SPR internalization in sham-injected animals (A), this same stimulation induces massive SPR internalization in animals that have significant bone destruction induced by the osteolytic sarcoma cells (B). These images, from 60-μm-thick tissue sections, are projected from 18 optical sections acquired at 0.8 μm intervals with a 100× lens. Scale bar, 10 μm.
Fig. 6.
Fig. 6.
Normally non-noxious mechanical stimulation induces SPR internalization and c-Fos expression in lamina I spinal neurons ipsilateral to the femur injected with osteolytic sarcoma cells. Results are expressed as number of c-Fos-expressing neurons (A) and percentage of internalized SPR-expressing neurons (B) in lamina I after normally non-noxious mechanical stimulation (palpation) 21 d after media injection (sham), sarcoma injection into the quadriceps muscle, or sarcoma injection into the femur (mean ± SEM). Note that palpation does not induce spinal c-Fos expression or SPR internalization in sham animals or in animals injected with sarcoma cells into the quadriceps muscle, but does in animals with sarcoma cells injected into the femur [p < 0.01 compared to sham animals with palpation and p < 0.001 compared to contralateral side (sham injection without palpation)]. One-way ANOVA and Fisher's PLSD; **p < 0.01, ***p < 0.001 compared to the contralateral side.

References

    1. Abbadie C, Besson J-M. c-Fos expression in rat lumbar spinal cord during the development of adjuvant-induced arthritis. Neuroscience. 1992;48:985–993. - PubMed
    1. Abbadie C, Besson J-M. c-Fos expression in rat lumbar spinal cord following peripheral stimulation in adjuvant-induced arthritis and in normal rats. Brain Res. 1993;607:195–204. - PubMed
    1. Abbadie C, Taylor BK, Peterson MA, Basbaum AI. Differential contribution of the two phases of the formalin test to the pattern of c-Fos expression in the rat spinal cord: studies with remifentanil and lidocaine. Pain. 1997a;69:101–110. - PubMed
    1. Abbadie C, Trafton J, Liu H, Mantyh PW, Basbaum AI. Inflammation increases the distribution of dorsal horn neurons that internalize the neurokinin-1 receptor in response to noxious and non-noxious stimulation. J Neurosci. 1997b;17:8049–8060. - PMC - PubMed
    1. Adami S. Bisphosphonates in prostate carcinoma. Cancer. 1997;80:1674–1679. - PubMed

Publication types

MeSH terms