. 1999 Dec 15;19(24):10948-65.
doi: 10.1523/JNEUROSCI.19-24-10948.1999.

Cytomegalovirus cell tropism, replication, and gene transfer in brain

Affiliations

Cytomegalovirus cell tropism, replication, and gene transfer in brain

A N van Den Pol et al. J Neurosci. .

Abstract

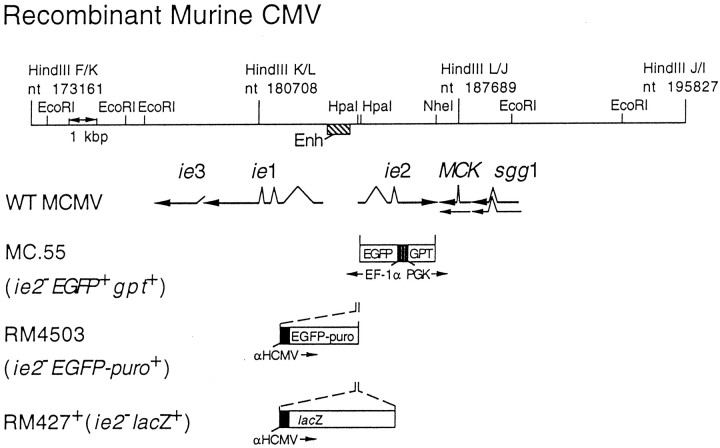
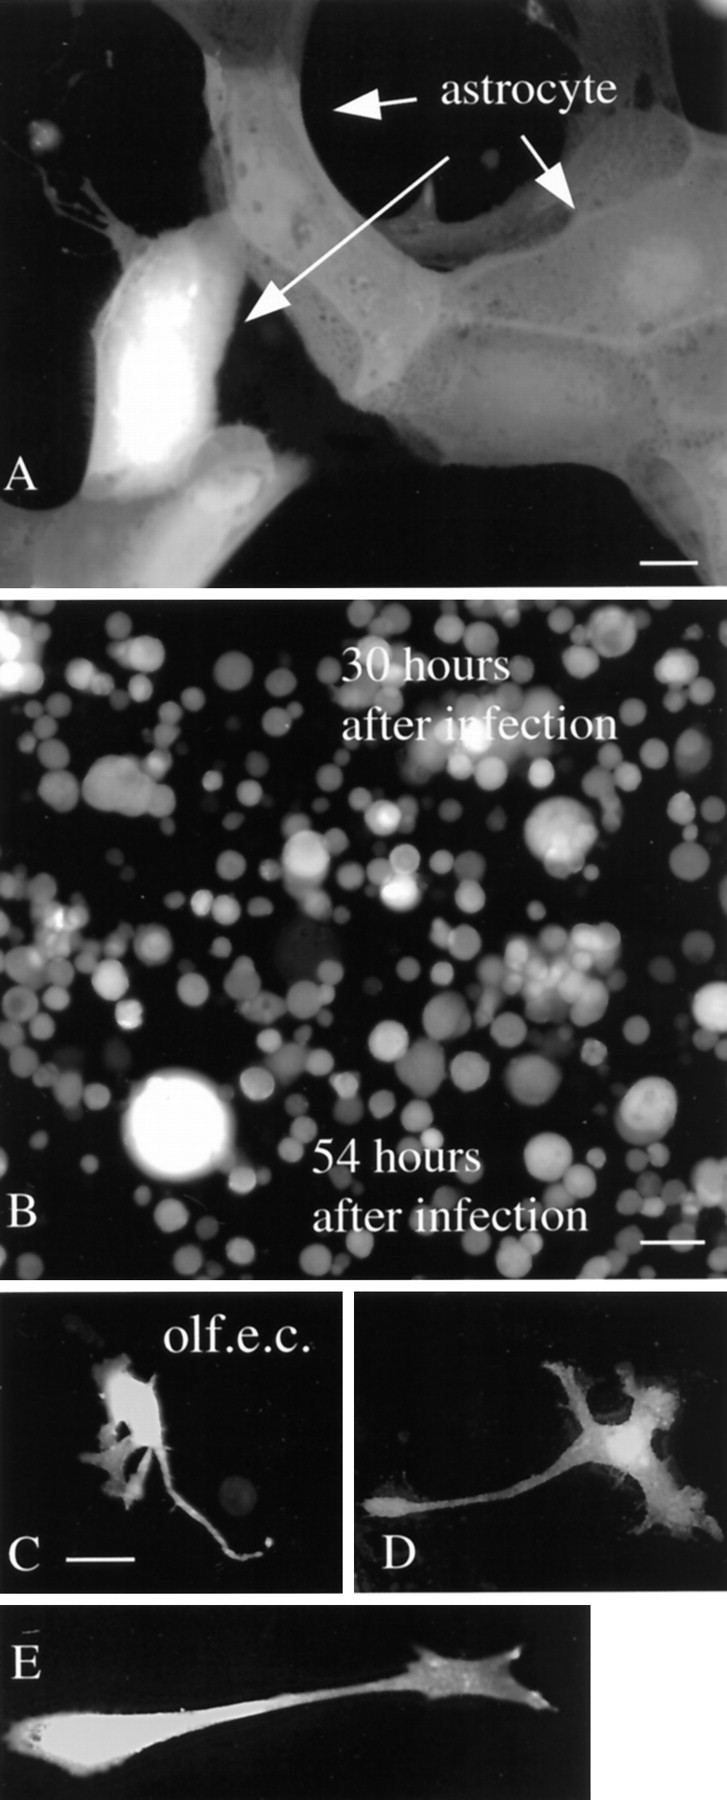
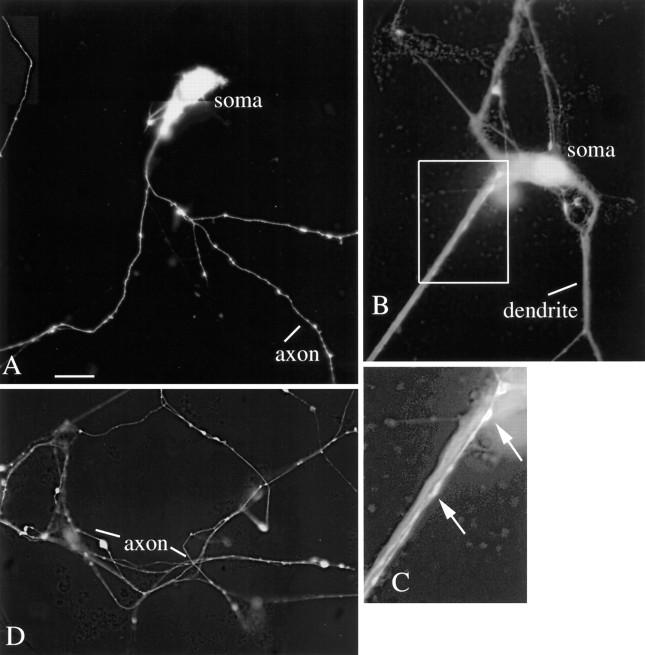
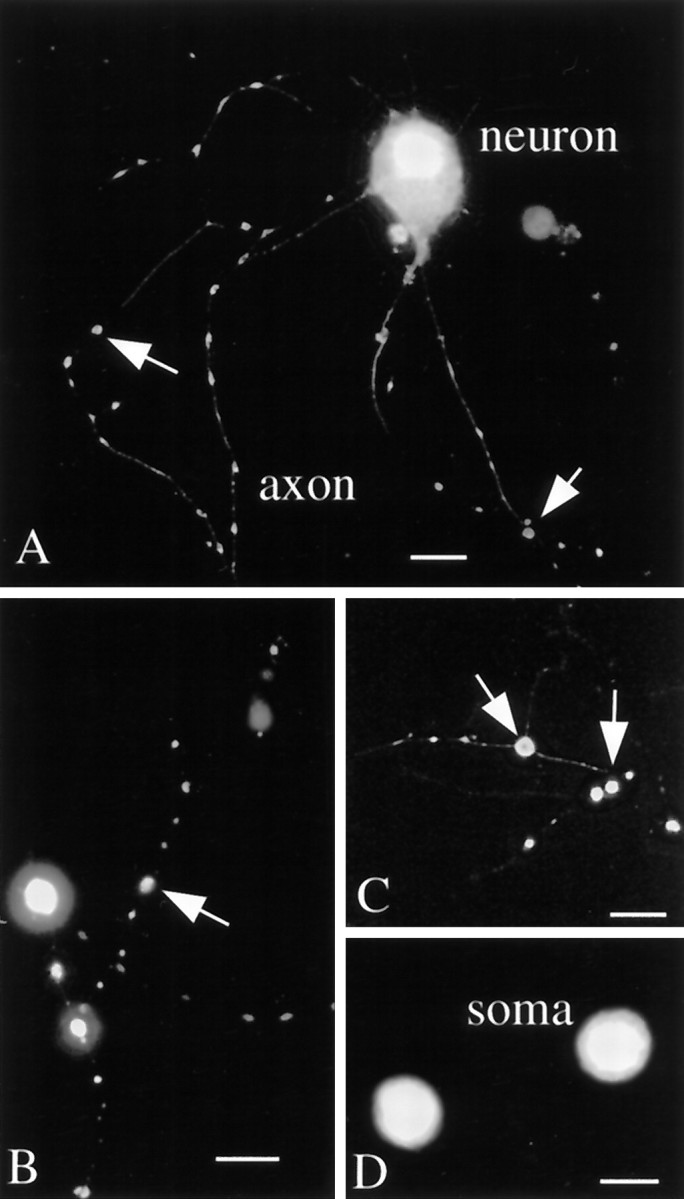
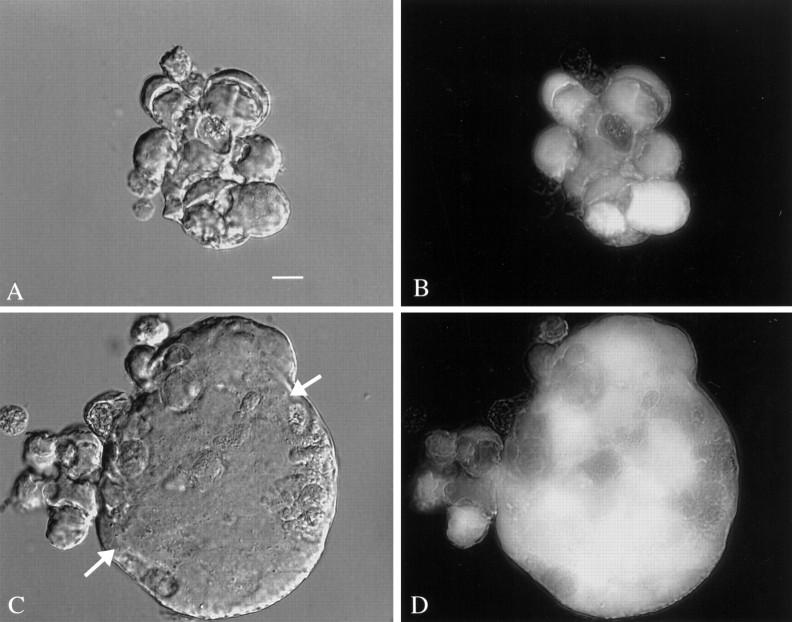
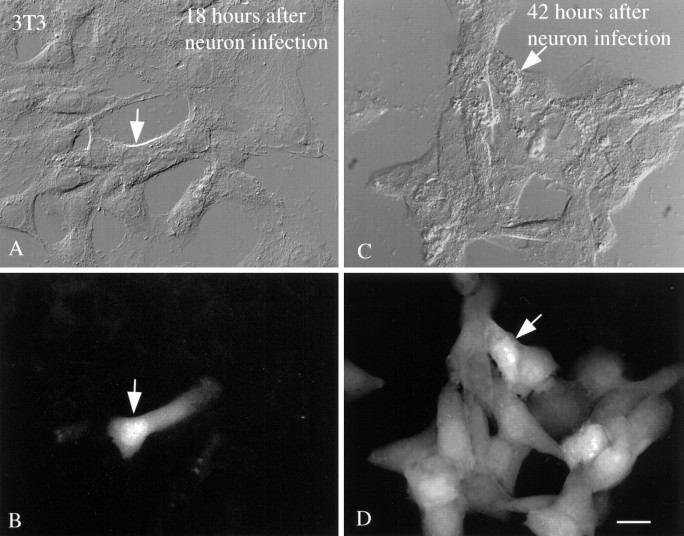
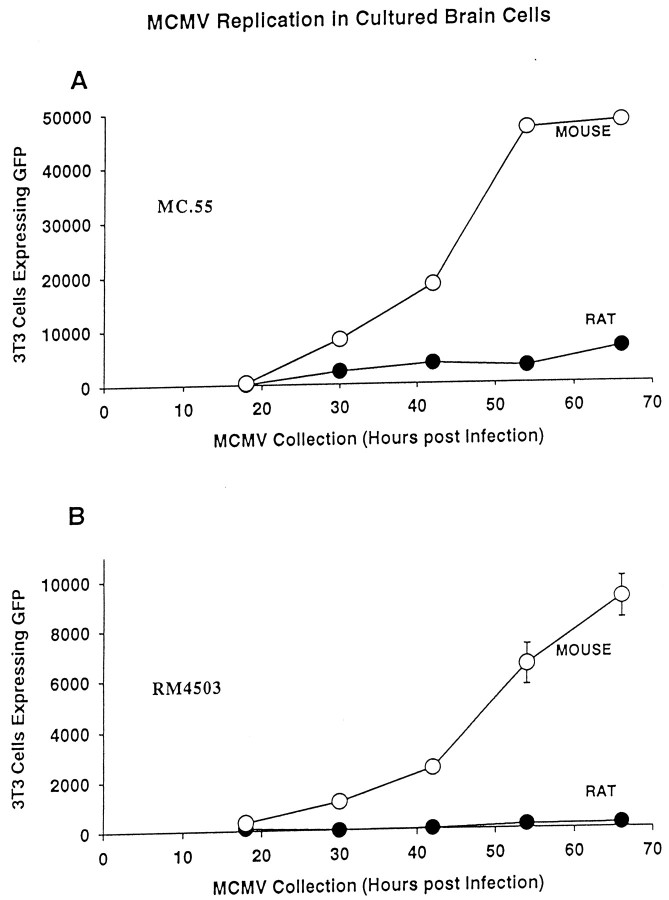
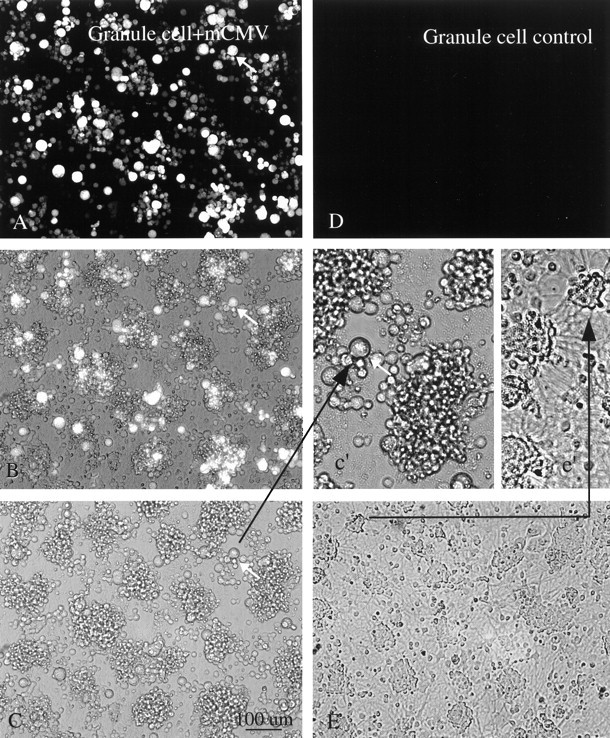
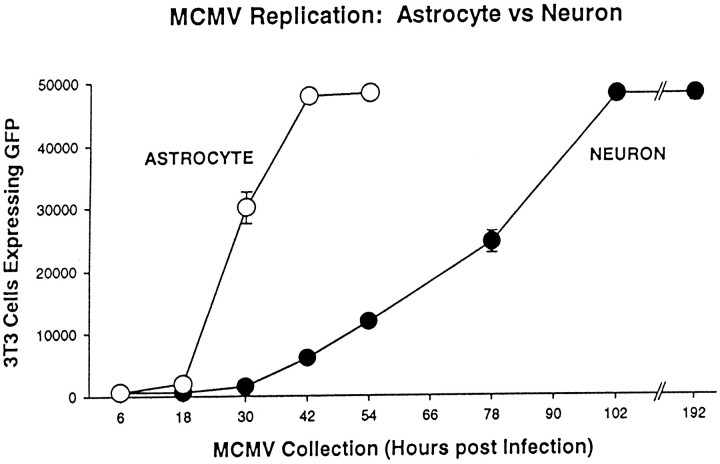
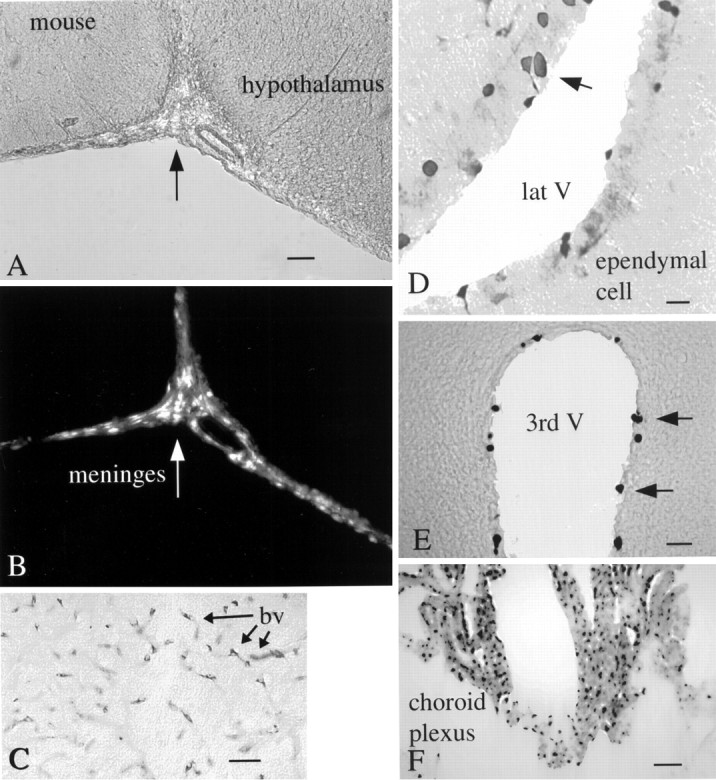
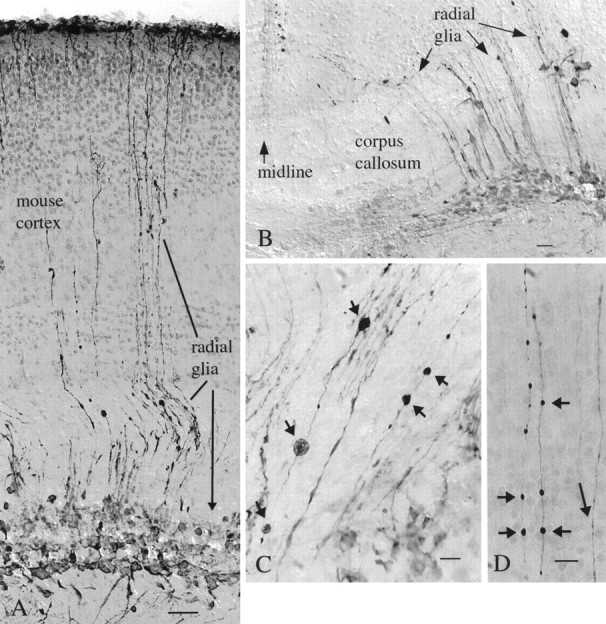
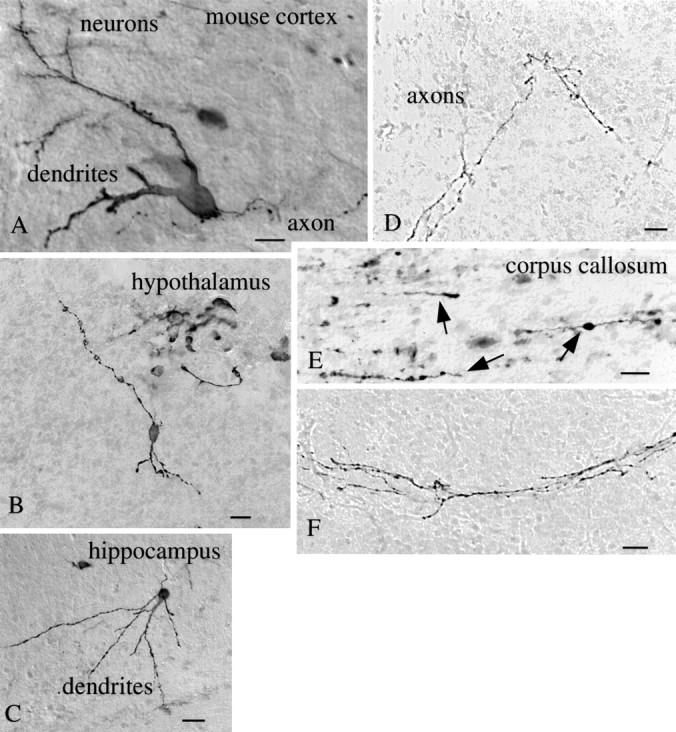
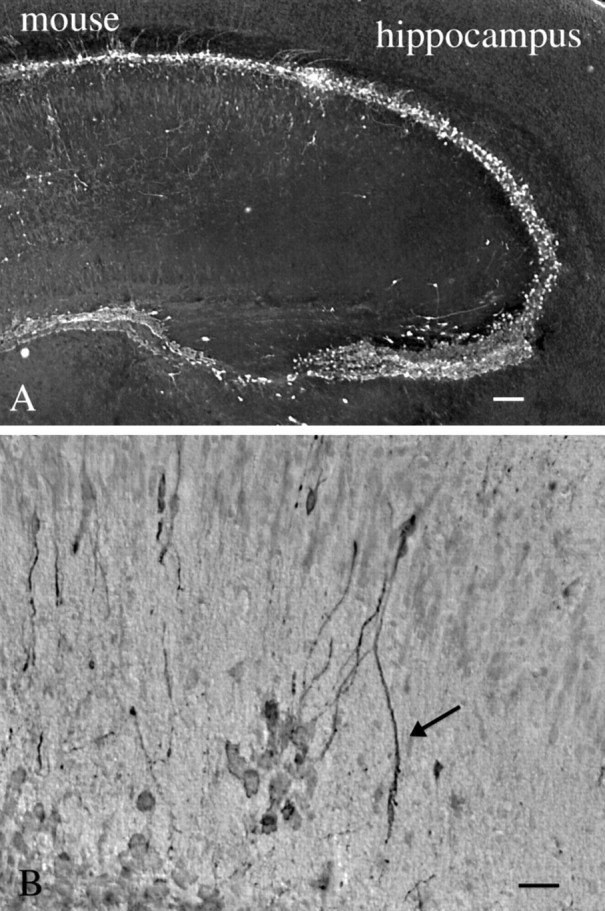
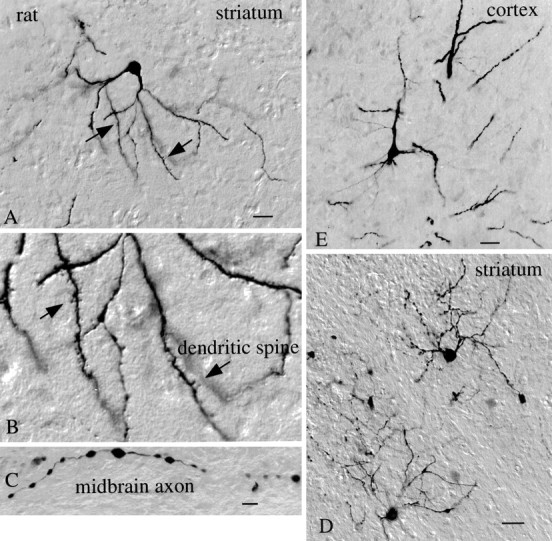
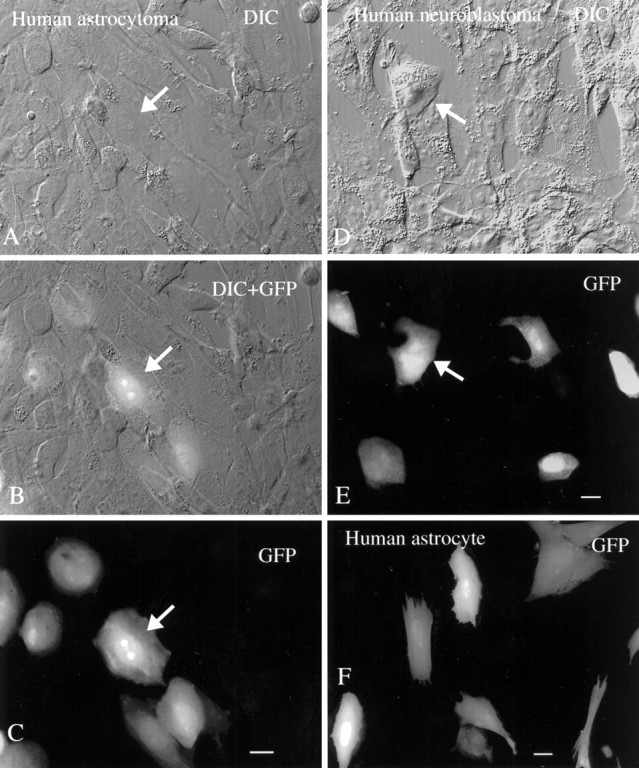
Cytomegalovirus (CMV) infects a majority of adult humans. During early development and in the immunocompromised adult, CMV causes neurological deficits. We used recombinant murine cytomegalovirus (mCMV) expressing either green fluorescent protein (GFP) or beta-galactosidase under control of human elongation factor 1 promoter or CMV immediate early-1 promoter as reporter genes for infected brain cells. In vivo and in vitro studies revealed that neurons and glial cells supported strong reporter gene expression after CMV exposure. Brain cultures selectively enriched in either glia or neurons supported viral replication, leading to process degeneration and cell death within 2 d of viral exposure. In addition, endothelial cells, tanycytes, radial glia, ependymal cells, microglia, and cells from the meninges and choroid were infected. Although mCMV showed no absolute brain cell preference, relative cell preferences were detected. Radial glia cells play an important role in guiding migrating neurons; these were viral targets in the developing brain, suggesting that cortical problems including microgyria that are a consequence of CMV may be caused by compromised radial glia. Although CMV is a species-specific virus, recombinant mCMV entered and expressed reporter genes in both rat and human brain cells, suggesting that mCMV might serve as a vector for gene transfer into brain cells of non-murine species. GFP expression was sufficiently strong that long axons, dendrites, and their associated spines were readily detected in both living and fixed tissue, indicating that mCMV reporter gene constructs may be useful for labeling neurons and their pathways.


Figures

Fig. 1.
Fig. 1.
Map of the HindIII K, L, and J fragments of murine CMV (K181+ strain). The murine CMVie1/ie2/ie3 transcriptional enhancer and the arrangement of ie1,ie2, ie3, sgg1, andMCK transcripts are also shown, with splicing patterns indicated on the arrows depicting individual transcripts as they appear in wild-type murine CMV. The lacZ insertion mutation in RM427+, the EGFP-puro insertion in RM4503–1, and the GFP–GPT insertion in MC.55 are depicted below the map. Expression of the lacZ gene in RM427+ was regulated by a 199 bp human CMV ie1/ie2 promoter (αHCMV) fragment (−219 to −19 relative to the transcription start site) (Manning et al., 1992). Expression of theEGFP-puro gene in RM4503 was regulated by a 249 bp human CMV ie1/ie2 promoter (−242 to + 7 relative to the transcription start site). These promoters display immediate early expression kinetics when placed adjacent to the murine CMV enhancer (Enh) in the HpaI sites of the ie2 gene (Manning et al., 1992; our unpublished observations). Expression of EGFP in MC.55 was regulated by the human elongation factor 1a promoter (EF-1α) (Uetsuki et al., 1989), whereas the E. coli GPT was under the control of the mouse phosphoglycerate kinase (PGK) promoter.
Fig. 2.
Fig. 2.
Glia infection in vitro.A, After 30 hr, most astrocytes in vitrowere green, indicating infection with mCMV. Scale bar, 8 μm.B, By 54 hr, most glia were dead or dying and had a round featureless shape. Scale bar, 25 μm.CE, Olfactory ensheathing cells (olf.e.c.) became green 30 hr after infection with CMV. Scale bar, 12 μm.
Fig. 3.
Fig. 3.
Mouse neurons in vitro: brief infection. A, A montage of a neuron in vitro for 5 d, 2 d after mCMV infection. Processes are labeled. Scale bar, 22 μm. B, A neuron with wide dendrites and a thin axon-like process in box.C, Higher magnification of box inB, showing a bright GFP-expressing axonal process growing on top of the dendrite. D, Axonal arbor 2 d after mCMV introduction.
Fig. 4.
Fig. 4.
Mouse neurons in vitro: extended infection. A, Four days after infection axons show a greater degree of beading than seen in control cultures.B, C, Some axons in late stages of degeneration show only a few poorly connected swellings that are fluorescent. Scale bar, 10 μm. D, Two somata are seen with unusual round shapes and are devoid of processes 5 d after infection. Scale bar, 12 μm.
Fig. 5.
Fig. 5.
Giant cells after mCMV infection. DIC images are shown on the left, and on the right are shown the same field with fluorescent microscopy for detecting GFP.A, B, Three days after infection of a mixed neuronal–glial culture, a small group of cells are tightly packed together but do not show characteristics of a giant cell.C, D, A giant cell appears to be composed of many other cells fused together and is seen with a few cells attached on the outside to the left. InC, the DIC image shows a relatively smooth outer membrane (arrows). Within the giant cell, a heterogeneous GFP-mediated fluorescence is seen, suggesting that there is not total cytoplasmic continuity at this point. Scale bar, 16 μm.
Fig. 6.
Fig. 6.
3T3 test cultures used for viral replication test.A, DIC image of NIH 3T3 culture incubated with tissue culture supernatant from brain cultures that had been infected for 18 hr. Arrow identifies a single cell. B, Same field as in A, showing a single fluorescent 3T3 cell (arrow). C, In parallel cultures, DIC imaging shows a group of 3T3 cells, one identified with anarrow to facilitate recognition in DIC and fluorescence.D, With fluorescent microscopy of the same field, most of the cells express GFP-mediated fluorescence. Tissue culture supernatant was taken from brain cultures 42 hr after mCMV infection. In both sets of experiments, 3T3 cells were examined 18 hr after their initial incubation with brain culture supernatant. Scale bar, 25 μm.
Fig. 7.
Fig. 7.
mCMV replication enhanced in mouse brain cultures.A, Using MC.55 that was engineered to express GFP under control of elongation factor 1 promoter, viral replication in brain cell cultures was studied by harvesting culture supernatant and determining the number of 3T3 cells that showed GFP expression. Mouse brain culture supernatant generated strong GFP label in an increasing number of 3T3 cells, to the point that all 3T3 cells in culture were labeled with medium from cultures 3 d after mCMV infection. Rat cultures showed a low level of viral replication. Forty-eight thousand 3T3 cells were plated per coverslip; the plateau between the last two mouse points was not attributable to a decrease in viral replication but rather to the fact that the maximum number of test 3T3 cells (48,000) had turned green. B, Parallel experiments were performed with the mCMV under control of the human CMV promoter (RM4503). Replication was found in mouse brain cultures but at a lower rate than found with MC.55. With this viral strain, replication in rat brain cultures as deduced by GFP expression in 3T3 cells was minimal.
Fig. 8.
Fig. 8.
Cerebellar granule neurons. A, Four days after mCMV (MC.55) infection of a culture enriched with granule cells, many of the cells show bright GFP fluorescence. The same cell is indicated by an arrow in A–c'to facilitate recognition. B, Same field as inA but with partial fluorescence, partial phase contrast. Some cells seen in phase contrast are not fluorescent.C, Same field as in A but only with phase contrast. Scale bar, 100 μm. A higher magnification ofC is shown in c' (arrow). Neurites are not found in these infected neurons. D, Control granule cell culture not infected with mCMV shows no fluorescence. E, Phase-contrast photomicrograph of culture 2 d after infection. Neurites are commonly found spreading out from groups of neurons, shown in higher magnification ine'.
Fig. 9.
Fig. 9.
mCMV replication in cultures enriched in astrocytes or neurons. Cultures enriched in cerebellar granule cells (neurons, ●) or astrocytes (○) were infected with MC.55. Viral replication was more rapid in the cultures enriched in astrocytes. Neuronal cultures also showed viral replication, but at a slower rate. Forty-eight thousand 3T3 cells were plated per coverslip.
Fig. 10.
Fig. 10.
Intracerebral injections into mouse brain. mCMV injections were made into the lateral hypothalamus, with the syringe needle passing through and releasing virus into the ventricular system.A, The ventral region of the brain that includes the lateral hypothalamus (right of arrow). Scale bar, 65 μm. B, Same field as inA; shows GFP labeling of the meninges (arrow). C, Cells surrounding the blood vessels (arrows, bv) of the mammillary bodies after nearby injection of mCMV; the GFP label was stained with immunoperoxidase. D, Ependymal cells (arrows) of the lateral ventricle (lat V) are labeled (arrow) after immunoperoxidase staining of GFP. E, Some of the ependymal cells of the third ventricle (3rd V) show viral infection after x-gal staining for β-gal.F, Many cells of the choroid plexus are labeled after injection of the β-gal expressing mCMV.
Fig. 11.
Fig. 11.
Preferential infection of radial glia in developing mouse cortex. A, In mouse cortex, radial glia appear to be the primary cells infected after mCMV injections into the P2 mouse. Long processes travel from the cell body layer (arrow) and ascend to the outer cortical surface. The syringe needle passed through the cortex and into the hippocampus, and cells were labeled in both places. Scale bar, 50 μm.B, In the same brain, near the midline, a number of processes cross the corpus callosum and continue through the developing gray matter. Scale bar, 15 μm. C, D, Processes of mCMV-infected radial glia in the deep cortex (C) and outer cortex (D) show dilations (small arrows) suggestive of pathology. Some dilations reach almost 10 μm in diameter. Other processes (long arrow) show no dilations. Scale bars: 20 μm. All micrographs here are after peroxidase immunostaining of GFP.
Fig. 12.
Fig. 12.
Mouse neuronal infection by mCMV. Neurons in the mouse brain were infected with mCMV as shown after immunoperoxidase staining of GFP in the cerebral cortex (A, scale bar, 12 μm), hypothalamus (B, scale bar, 20 μm), and hippocampus (C, scale bar, 25 μm). Axons show GFP label with no nearby neuronal cell body labeling, as shown inD (scale bar, 8 μm), E (scale bar, 5 μm), and F (scale bar, 8 μm). In Ethe GFP-expressing axons run parallel to the axis of many other axons running in the corpus callosum.
Fig. 13.
Fig. 13.
mCMV in neonatal mouse hippocampus.A, After intracerebral injection into the P2 mouse, cells surrounding the hippocampus show strong evidence of infection 3 d later. Scale bar, 45 μm. B, Higher magnification of the same brain shows labeling of some dendritic arbors (arrow) ventral to the pyramidal cell layer. Scale bar, 20 μm.
Fig. 14.
Fig. 14.
mCMV infects neurons of the rat brain.A, A medium-size spiny cell of the rat striatum is labeled 3 d after nearby mCMV administration and immunoperoxidase staining for GFP. Scale bar, 25 μm. B, Higher magnification of A shows high density of dendritic spines (arrows) on labeled cell. C, Axon in the midbrain, from the same brain asAD, shows labeling. Scale bar, 8 μm.D, On an adjacent section to A, two more striatal neurons with their dendrites and axons show evidence of mCMV infection. Scale bar, 30 μm. E, Neuron from cerebral cortex was infected with mCMV. Scale bar, 20 μm.
Fig. 15.
Fig. 15.
Human brain cells are infected with mouse CMV. AC, DIC, DIC + GFP, and GFP images of the same microscope field containing glial cells from a human astrocytoma are shown. A subset of cells shows strong GFP-mediated fluorescence. Scale bar, 10 μm. D, E, The same field shows the DIC image (D) and the GFP image (E). A subset of human neuroblastoma cells, 2 d after plating with mCMV, is infected with virus. Scale bar, 10 μm. F, “Normal” glial cells with an astrocyte morphology were cultured from human brain and show GFP expression 30 hr after infection. Scale bar, 10 μm.

Similar articles

Cited by

References

    1. Alford CA, Britt WJ. Cytomegalovirus. In: Fields BN, Knipe DM, Howley PM, editors. Fields virology. Lippincott-Raven; New York: 1996. pp. 2493–2534.
    1. Arribas JR, Clifford DB, Fichtenbaum CJ, Commins DL, Powderly WG, Storch GA. Level of cytomegalovirus (CMV) DNA in cerebrospinal fluid of subjects with AIDS and CMV infection of the central nervous system. J Infect Dis. 1995;172:527–531. - PubMed
    1. Bale JF, Jr, Bray PF, Bell WE. Neuroradiographic abnormalities in congenital cytomegalovirus infection. Pediat Neurol. 1985;1:42–47. - PubMed
    1. Bartlett JS, Samulski RJ, McCown TJ. Selective and rapid uptake of adeno-associated virus type 2 in brain. Hum Gene Ther. 1998;9:1181–1186. - PubMed
    1. Baskar JF, Smith PP, Nilaver G, Jupp RA, Hoffmann S, Peffer NJ, Tenney DJ, Colberg-Poley AM, Ghazal P, Nelson JA. The enhancer domain of the human cytomegalovirus major immediate-early promoter determines cell type-specific expression in transgenic mice. J Virol. 1996;70:3207–3214. - PMC - PubMed

Publication types

MeSH terms

Substances

LinkOut - more resources