. 1999 Dec;121(4):1069-80.
doi: 10.1104/pp.121.4.1069.

Apoplastic pH and Fe(3+) reduction in intact sunflower leaves

Affiliations

Apoplastic pH and Fe(3+) reduction in intact sunflower leaves

HU Kosegarten et al. Plant Physiol. 1999 Dec.

Abstract

It has been hypothesized that under NO(3)(-) nutrition a high apoplastic pH in leaves depresses Fe(3+) reductase activity and thus the subsequent Fe(2+) transport across the plasmalemma, inducing Fe chlorosis. The apoplastic pH in young green leaves of sunflower (Helianthus annuus L.) was measured by fluorescence ratio after xylem sap infiltration. It was shown that NO(3)(-) nutrition significantly increased apoplastic pH at distinct interveinal sites (pH >/= 6.3) and was confined to about 10% of the whole interveinal leaf apoplast. These apoplastic pH increases presumably derive from NO(3)(-)/proton cotransport and are supposed to be related to growing cells of a young leaf; they were not found in the case of sole NH(4)(+) or NH(4)NO(3) nutrition. Complementary to pH measurements, the formation of Fe(2+)-ferrozine from Fe(3+)-citrate was monitored in the xylem apoplast of intact leaves in the presence of buffers at different xylem apoplastic pH by means of image analysis. This analysis revealed that Fe(3+) reduction increased with decreasing apoplastic pH, with the highest rates at around pH 5. 0. In analogy to the monitoring of Fe(3+) reduction in the leaf xylem, we suggest that under alkaline nutritional conditions at interveinal microsites of increased apoplastic pH, Fe(3+) reduction is depressed, inducing leaf chlorosis. The apoplastic pH in the xylem vessels remained low in the still-green veins of leaves with intercostal chlorosis.


Figures

Figure 1
Figure 1
Light transmission at 720 nm (A) and 560 nm (B) and the maximal light transmission ratio (720/560 nm; C) in the xylem vessel of a control leaf (without ferrozine) of sunflower. The maximal light transmission ratio (720/560 nm) in the xylem vessel (without Fe-ferrozine complex) is displayed by yellow pseudocolor (C). Scale, 240 μm. The histogram (D) shows the distribution of the pixel intensity in the ratio picture (C) of the xylem vessel. The maximal light transmission ratio shows a pixel value of 101.3 ± 3.9 (n = 9).
Figure 2
Figure 2
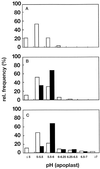
Relative frequency of apoplast pH (n = 100) of epidermal and stomatal cells in the intercostal area at the leaf base in relation to different N nutrition and light/dark changes. A, 1 mm NH4+; B, 3 mm NH4NO3; C, 6 mm NO3/10 mm HCO3. Dark period, 5 h. White bars, Light; black bars, dark.
Figure 3
Figure 3
Apoplast pH (A) and fluorescence intensity after excitation at 490 nm (B) of the upper cell layer of a sunflower leaf after 5 h of darkness as examined by microscope image analysis. Plants were cultivated with 6 mm NO3/10 mm HCO3. The light-blue pseudocolor in the left picture corresponds to a pH of around 5.7, the green pseudocolor to a pH of around 6.5, and the yellow pseudocolor to a pH of around 7.0. The fluorescence intensity is high in the xylem vessels and in the stomatal region, as shown by the red, yellow, and light-blue pseudocolors (B). Scale, 80 μm.
Figure 4
Figure 4
Intercostal chlorosis in young sunflower leaves. The apoplast pH was measured with a fluorescence microscope in the yellow intercostal area and the green xylem vessels (arrows).
Figure 5
Figure 5
Light transmission in the xylem vessels at pH 5.4 (A, 720 nm; B, 560 nm) and at pH 7.7 (C, 720 nm; D, 560 nm) after infiltration of Fe3+-citrate and ferrozine at different apoplastic pH levels. Scale, 240 μm.
Figure 6
Figure 6
Light transmission ratio (720/560 nm) in the xylem vessels (A and B) after infiltration of Fe3+-citrate and ferrozine at different apoplastic pH levels. A, pH 7.7; yellow pseudocolor represents high light transmission ratio. B, pH 5.4; light-blue pseudocolor shows low light transmission ratio. Scale, 240 μm. The distribution of the pixel intensity in the histogram is shown at pH 7.7 (C) and at pH 5.4 (D), with a maximum at 106.6 ± 3.4 (n = 9) and at 139.7 ± 5.8 (n = 9), respectively. A shift to higher pixel values indicates a reduction in the light transmission ratio.

Similar articles

Cited by

References

    1. Aktas M, Van Egmond M. Effect of nitrate nutrition on Fe utilization by an Fe-efficient and an Fe-inefficient soybean cultivar. Plant Soil. 1979;51:257–274.
    1. Bouche-Pillon S, Fleurat-Lessard P, Fromont J-C, Serrano R, Bonnemain J-L. Immunolocalization of the plasmamembrane H+-ATPase in minor veins of Vicia faba in relation to phloem loading. Plant Physiol. 1994;105:691–697. - PMC - PubMed
    1. Brown JC. Mechanism of iron uptake by plants. Plant Cell Environ. 1978;1:249–257.
    1. Brüggemann W, Maas-Kantel K, Moog PR. Iron uptake by leaf mesophyll cells: the role of the plasma membrane-bound ferric-chelate reductase. Planta. 1993;190:151–155.
    1. Brüggemann W, Moog PR. NADH-dependent Fe3+-EDTA and oxygen reduction by plasmamembrane vesicles from barley roots. Physiol Plant. 1989;75:245–254.

LinkOut - more resources