. 1999 Dec 20;190(12):1741-54.
doi: 10.1084/jem.190.12.1741.

Commitment and differentiation of osteoclast precursor cells by the sequential expression of c-Fms and receptor activator of nuclear factor kappaB (RANK) receptors

Affiliations

Commitment and differentiation of osteoclast precursor cells by the sequential expression of c-Fms and receptor activator of nuclear factor kappaB (RANK) receptors

F Arai et al. J Exp Med. .

Abstract

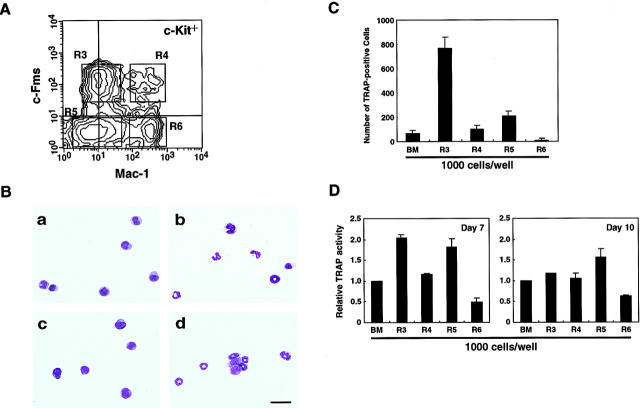
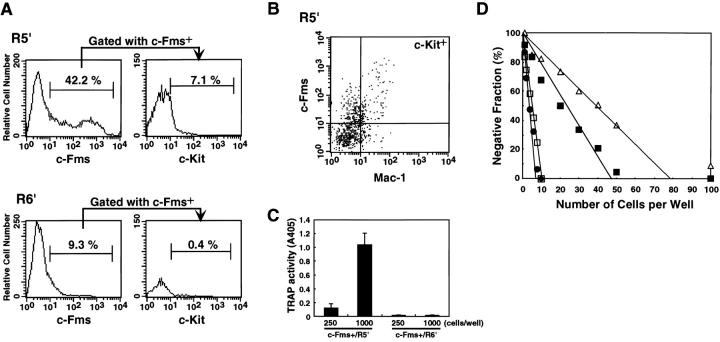
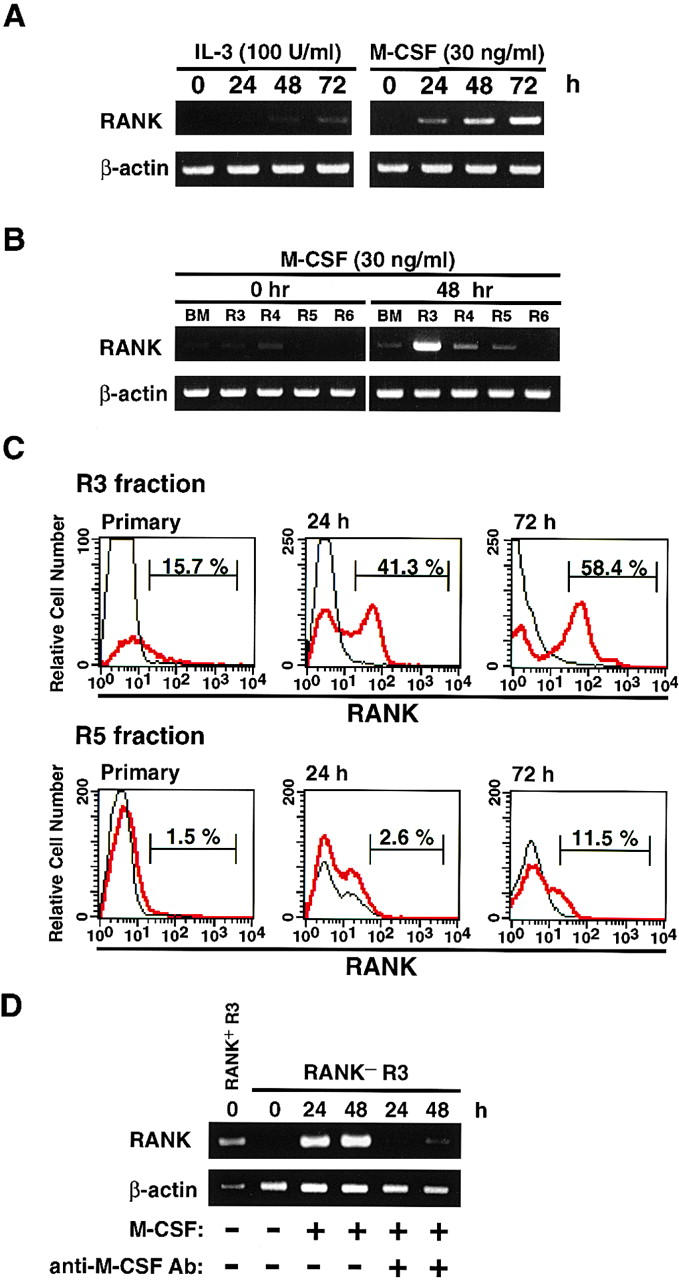
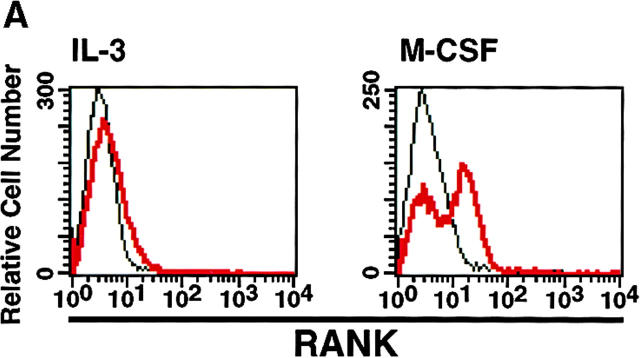
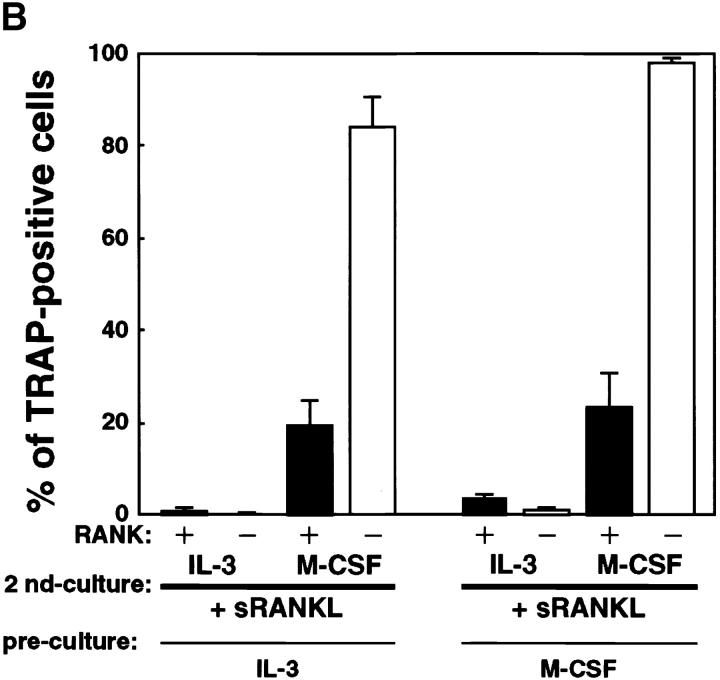
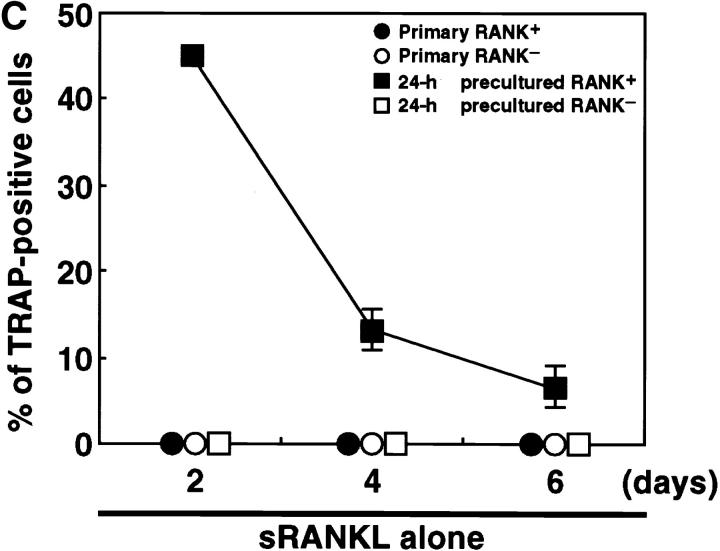
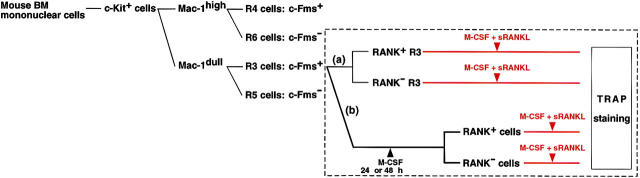
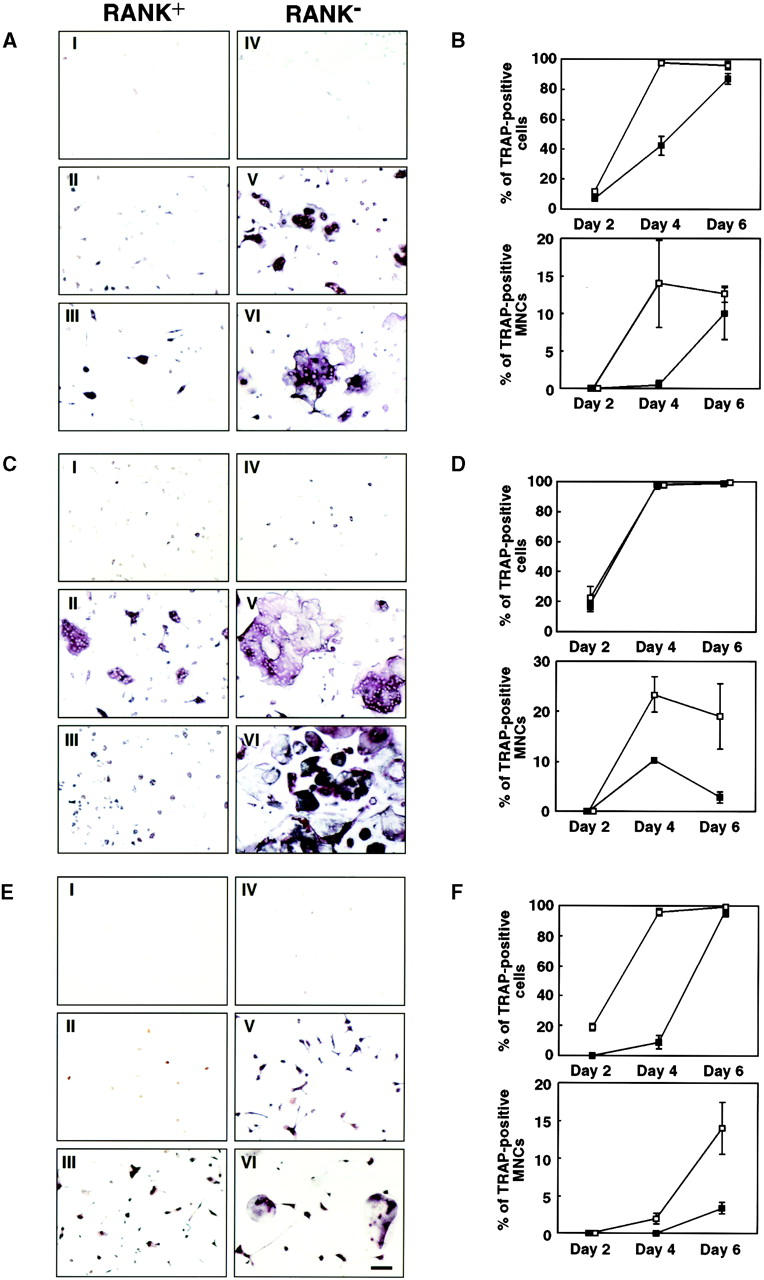
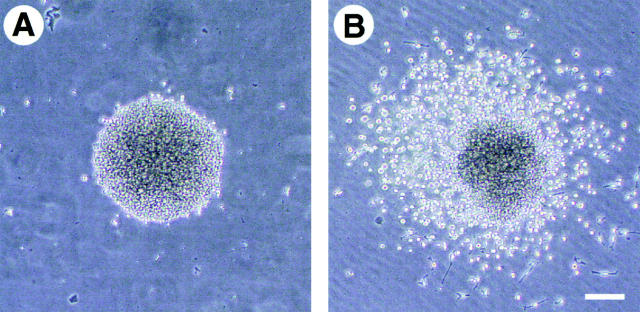
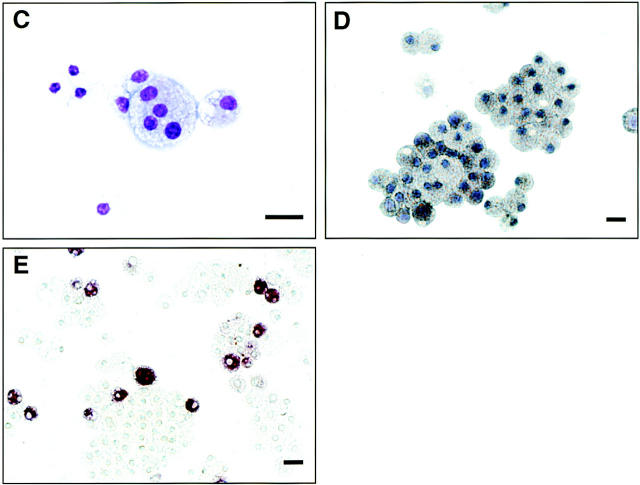
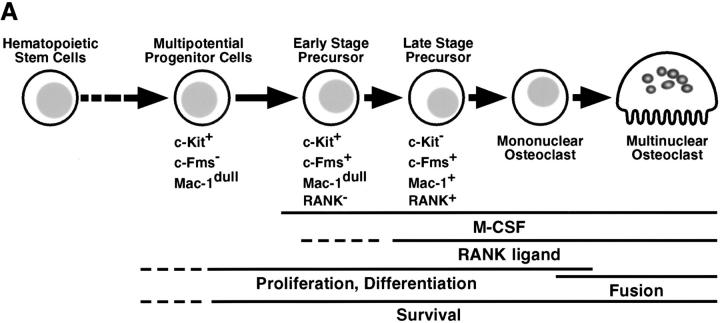
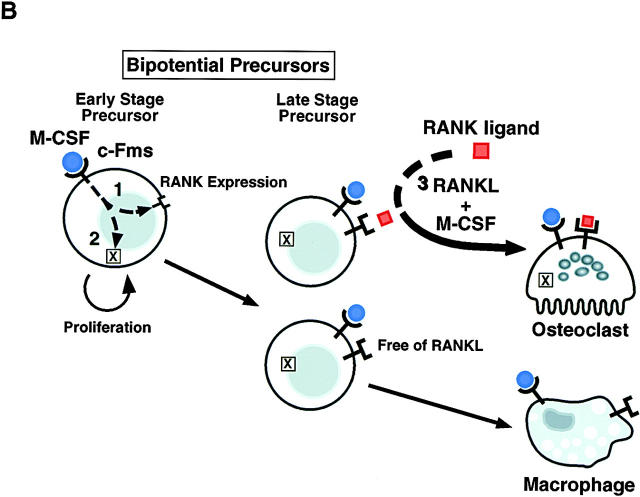
Osteoclasts are terminally differentiated cells derived from hematopoietic stem cells. However, how their precursor cells diverge from macrophagic lineages is not known. We have identified early and late stages of osteoclastogenesis, in which precursor cells sequentially express c-Fms followed by receptor activator of nuclear factor kappaB (RANK), and have demonstrated that RANK expression in early-stage of precursor cells (c-Fms(+)RANK(-)) was stimulated by macrophage colony-stimulating factor (M-CSF). Although M-CSF and RANKL (ligand) induced commitment of late-stage precursor cells (c-Fms(+)RANK(+)) into osteoclasts, even late-stage precursors have the potential to differentiate into macrophages without RANKL. Pretreatment of precursors with M-CSF and delayed addition of RANKL showed that timing of RANK expression and subsequent binding of RANKL are critical for osteoclastogenesis. Thus, the RANK-RANKL system determines the osteoclast differentiation of bipotential precursors in the default pathway of macrophagic differentiation.


Figures

Figure 1
Figure 1
Differentiation of TRAP+ cells from fractionated mouse BM mononuclear cells. (A) Expression of c-Fms and Mac-1 (CD11b) on BM mononuclear cells was analyzed by FACS® gated with c-Kit+ cells. c-Kit+ cells were subdivided further into four fractions based on expression of c-Fms and Mac-1. R3, c-Kit+Mac-1dullc-Fms+; R4, c-Kit+Mac-1highc-Fms+; R5, c-Kit+ Mac-1dullc-Fms; and R6, c-Kit+Mac-1highc-Fms. (B) Fractionated cells were examined by May-Grünwald-Giemsa staining. (a) R3; (b) R4; (c) R5; and (d) R6. Scale bar, 50 μm. (C) 103 cells of each fraction were cocultured with ST2 stromal cells in the presence of 1,25-(OH)2D3 (10−8 M) and Dex (10−7 M), and the number of TRAP+ cells was determined on day 4. (D) Relative TRAP activities were measured on days 7 and 10 of coculture with ST2 stromal cells. TRAP activity from unfractionated BM cells was set at 1.0.
Figure 2
Figure 2
Differentiation of c-Kit+Mac-1dullc-Fms cells. Cells derived from R5 and R6 fractions were cultured for 2 d with SCF (100 ng/ml; cultured cells were designated R5′ and R6′, respectively). (A) Expression of c-Fms on R5′ and R6′ cells. A gate was set on c-Fms+ cells, and the expression of c-Kit was analyzed. A fluorescence histogram shows the c-Kit staining profile of the fraction gated with c-Fms+. (B) Expression of Mac-1 and c-Fms on c-Kit+ cells. (C) c-Fms+ cells were sorted from R5′ or R6′. 103 or 2.5 × 10² cells of each fraction were cocultured with ST2 stromal cells and 1,25-(OH)2D3 (10−8 M) for 4 d, and TRAP activity was measured. (D) Limiting dilution analysis of unfractionated BM mononuclear cells (▵), R3 (•), R5 (▪), and c-Kit+c-Fms+ R5′ cells (□). Cells were cocultured with ST2 stromal cells for 4 d, and the percentages of TRAP+ cells were determined.
Figure 3
Figure 3
Expression of RANK on unfractionated BM cells or fractionated cells. Expression of RANK mRNA was analyzed by RT-PCR. (A) BM mononuclear cells were cultured with IL-3 (100 U/ml; left panel) or M-CSF (30 ng/ml; right panel), and the expression of RANK mRNA was examined before and after 24, 48, or 72 h of culture. (B) Fractionated BM cells were cultured for 48 h with M-CSF (30 ng/ml), and the expression of RANK was examined before and after 48 h of culture. (C) Expression of RANK protein on BM R3 or R5 cells was analyzed by FACS®. R3 (upper panels) or R5 (lower panels) cells were cultured for 24 or 72 h with M-CSF (30 ng/ml), and the expression of RANK was analyzed. Red line, anti-RANK; black line, rat IgG2a. (D) R3 cells (c-Kit+Mac-1dullc-Fms+) were divided into RANK+ or RANK cells, and RANK R3 cells were cultured for 24 or 48 h in the presence of M-CSF (30 ng/ml) with or without anti–mouse M-CSF neutralizing antibody (10 μg/ml). The expression of RANK was analyzed by RT-PCR.
Figure 4
Figure 4
Both RANKL and M-CSF regulate the differentiation of osteoclasts. (A) R3 cells were cultured with IL-3 (100 U/ml) or M-CSF (30 ng/ml) for 72 h. A fluorescence histogram shows the RANK staining profile after 72-h cultivation with IL-3 (left panel) or M-CSF (right panel). (B) RANK+ (black column) and RANK (white column) cells were sorted from IL-3– or M-CSF–precultured R3 cells and were then cultured with sRANKL (25 ng/ml) and IL-3 (100 U/ml) or M-CSF (100 ng/ml). The percentage of TRAP+ cells was determined on day 4. (C) Percentages of TRAP+ cells differentiated from primary RANK+ (•), primary RANK (○), and M-CSF 24-h–precultured RANK+ (▪) or RANK (□) cells in the R3 fraction were determined after cultivation with sRANKL for 2, 4, or 6 d.
Figure 4
Figure 4
Both RANKL and M-CSF regulate the differentiation of osteoclasts. (A) R3 cells were cultured with IL-3 (100 U/ml) or M-CSF (30 ng/ml) for 72 h. A fluorescence histogram shows the RANK staining profile after 72-h cultivation with IL-3 (left panel) or M-CSF (right panel). (B) RANK+ (black column) and RANK (white column) cells were sorted from IL-3– or M-CSF–precultured R3 cells and were then cultured with sRANKL (25 ng/ml) and IL-3 (100 U/ml) or M-CSF (100 ng/ml). The percentage of TRAP+ cells was determined on day 4. (C) Percentages of TRAP+ cells differentiated from primary RANK+ (•), primary RANK (○), and M-CSF 24-h–precultured RANK+ (▪) or RANK (□) cells in the R3 fraction were determined after cultivation with sRANKL for 2, 4, or 6 d.
Figure 5
Figure 5
Flow chart of FACS® analysis and the points for further examination. Mouse BM c-Kit+ cells were divided into four fractions (R3, R4, R5, and R6) as described in the Fig. 1 legend. The box enclosed with dashed lines indicates further analysis performed in Fig. 6. (a) R3 cells (c-Kit+Mac-1dullc-Fms+) were subdivided into RANK+ or RANK cells, and each fraction was cultured in the presence of M-CSF and sRANKL. (b) R3 cells were cultured for 24 or 72 h with M-CSF and were subdivided into RANK+ or RANK cells. 24- or 72-h–precultured RANK+ and RANK cells were cultured with both M-CSF and sRANKL. Red line, cultivation with M-CSF and sRANKL; dark blue line, cultivation with M-CSF.
Figure 6
Figure 6
Differentiation of TRAP+ cells from RANK+ or RANK cells. R3 cells were precultured with M-CSF (30 ng/ml) for 24 or 72 h. These precultured cells and primary R3 cells were then divided into RANK+ or RANK fractions. Primary and cultured RANK+ or RANK cells were cultured with sRANKL (25 ng/ml) and M-CSF (100 ng/ml). (A and B) Primary R3 cells. (C and D) 24-h M-CSF–precultured cells. (E and F) M-CSF 72-h–precultured cells. TRAP staining (A, C, and E) was performed on day 2 (I and IV), day 4 (II and V), or day 6 (III and VI), and the percentage of TRAP+ cells or TRAP+ MNCs (B, D, and F) was scored at the same time. I, II, and III were derived from RANK+ cells; IV, V, and VI were from RANK cells. Scale bar, 100 μm. Upper panels of B, D, and F represent percentages of TRAP+ cells that include both mononuclear cells and MNCs in the total cells in the well. Lower panels of B, D, and F represent percentages of TRAP+ MNCs in total TRAP+ cells in the well. Percent of TRAP+ cells or TRAP+ MNCs derived from RANK+ (▪) or RANK (□) cells is shown.
Figure 7
Figure 7
Colony formation from BM cells in the presence of sRANKL and M-CSF. R3 cells were cultured in methylcellulose medium with M-CSF (100 ng/ml) and sRANKL (25 ng/ml) for 7 d. Shown are pure macrophage colonies in the presence of M-CSF (A), colonies formed in the presence of sRANKL and M-CSF (B), and individual cells in osteoclast-containing colonies stained for May-Grünwald-Giemsa (C), with nonspecific esterase (D), and for TRAP (E). Scale bars, 10 μm (A and B) and 25 μm (C, D and E).
Figure 7
Figure 7
Colony formation from BM cells in the presence of sRANKL and M-CSF. R3 cells were cultured in methylcellulose medium with M-CSF (100 ng/ml) and sRANKL (25 ng/ml) for 7 d. Shown are pure macrophage colonies in the presence of M-CSF (A), colonies formed in the presence of sRANKL and M-CSF (B), and individual cells in osteoclast-containing colonies stained for May-Grünwald-Giemsa (C), with nonspecific esterase (D), and for TRAP (E). Scale bars, 10 μm (A and B) and 25 μm (C, D and E).
Figure 8
Figure 8
Model of osteoclast differentiation derived from hematopoietic stem cells. (A) Sequential phenotypic progression of osteoclasts and relevant factors. (B) Determination of osteoclastic differentiation in the presence of M-CSF and RANKL.
Figure 8
Figure 8
Model of osteoclast differentiation derived from hematopoietic stem cells. (A) Sequential phenotypic progression of osteoclasts and relevant factors. (B) Determination of osteoclastic differentiation in the presence of M-CSF and RANKL.

Similar articles

Cited by

References

    1. Ash P., Loutit J.F., Townsend K.M. Osteoclasts derived from haematopoietic stem cells. Nature. 1980;283:669–670. - PubMed
    1. Scheven B.A., Visser J.W., Nijweide P.J. In vitro osteoclast generation from different bone marrow fractions, including a highly enriched haematopoietic stem cell population. Nature. 1986;321:79–81. - PubMed
    1. Kurihara N., Suda T., Miura Y., Nakauchi H., Kodama H., Hiura K., Hakeda Y., Kumegawa M. Generation of osteoclasts from isolated hematopoietic progenitor cells. Blood. 1989;74:1295–1302. - PubMed
    1. Roodman G.D. Advances in bone biologythe osteoclast. Endocr. Rev. 1996;17:308–332. - PubMed
    1. Manolagas S.C., Jilka R.L. Bone marrow, cytokines, and bone remodeling. Emerging insights into the pathophysiology of osteoporosis. N. Engl. J. Med. 1995;332:305–311. - PubMed

Publication types

MeSH terms

Substances