

Voltage-gated and resting membrane currents recorded from B-cells in intact mouse pancreatic islets
- PMID: 10601501
- PMCID: PMC2269694
- DOI: 10.1111/j.1469-7793.1999.00717.x
Voltage-gated and resting membrane currents recorded from B-cells in intact mouse pancreatic islets
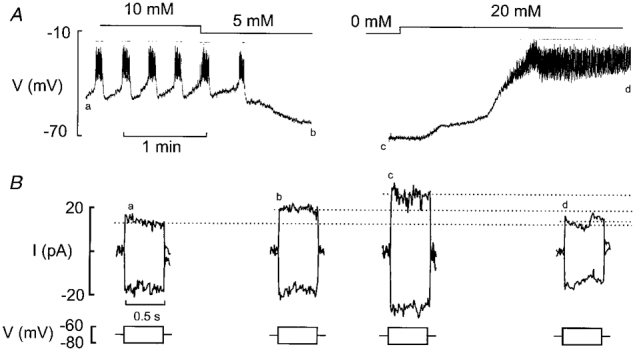
Abstract
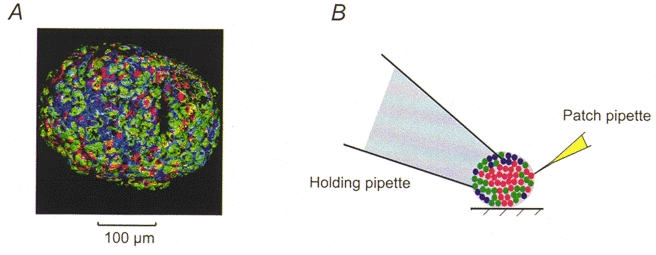
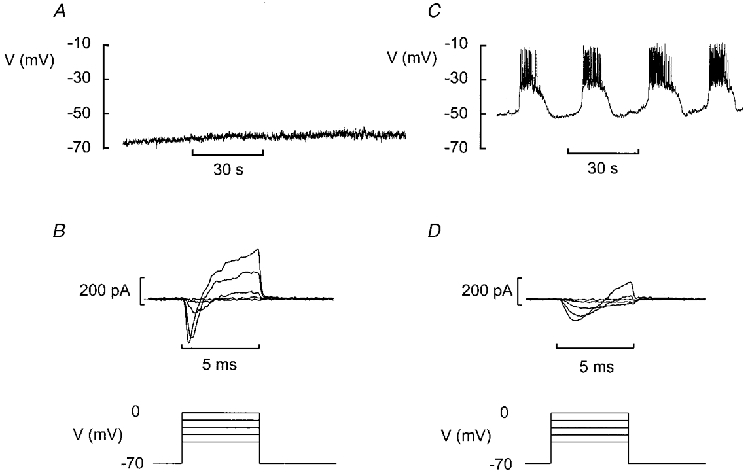
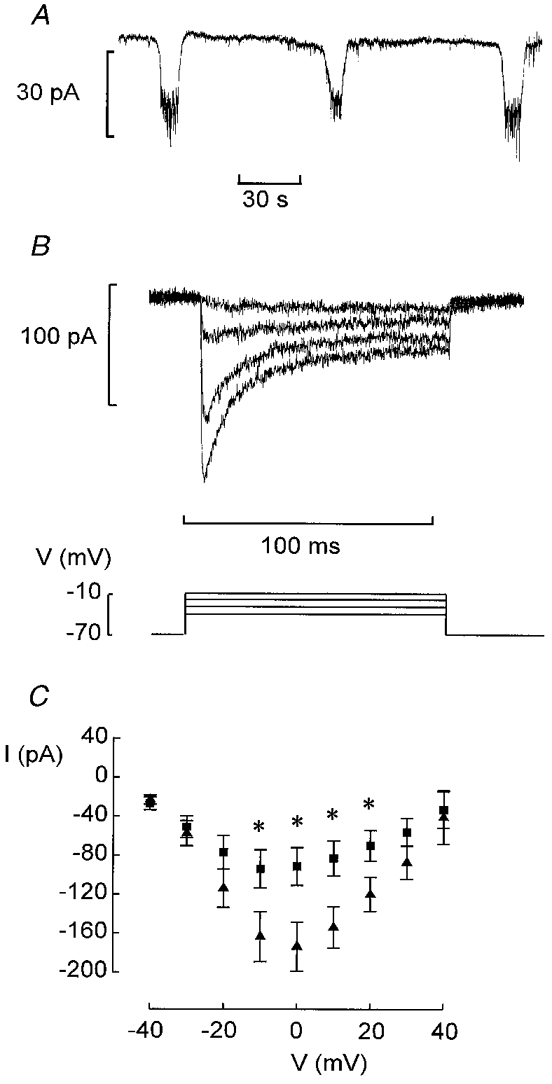
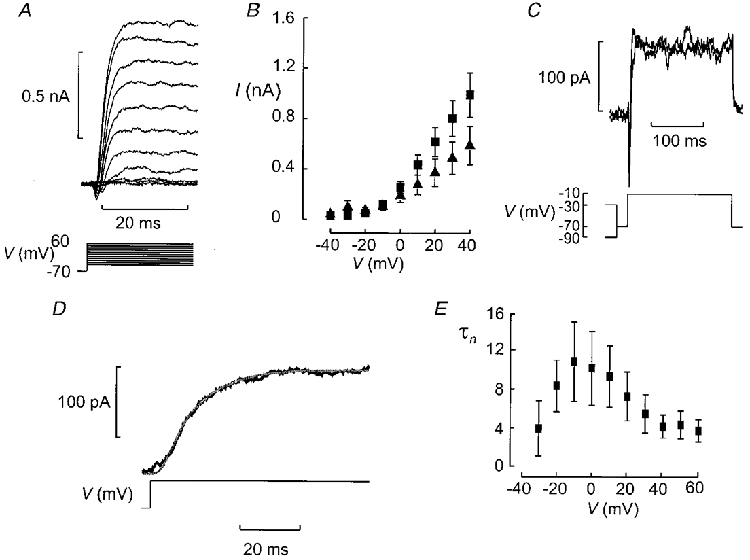
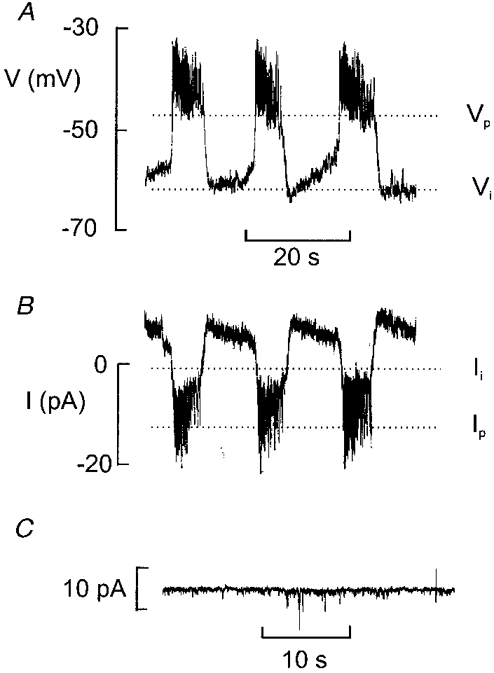
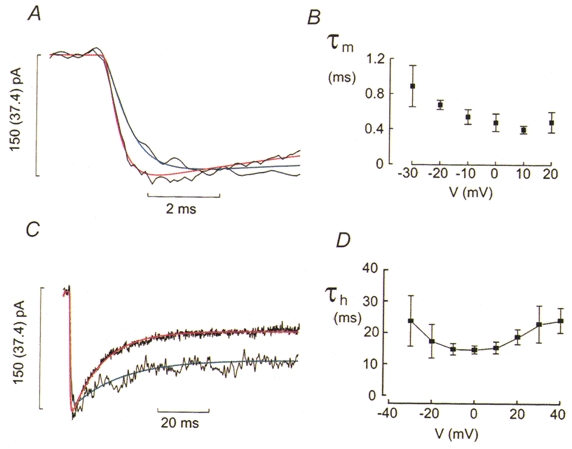
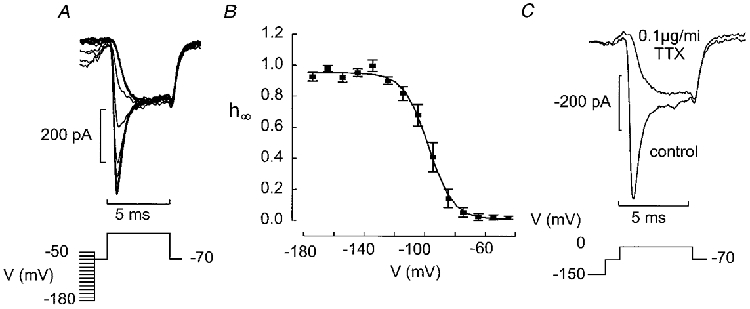
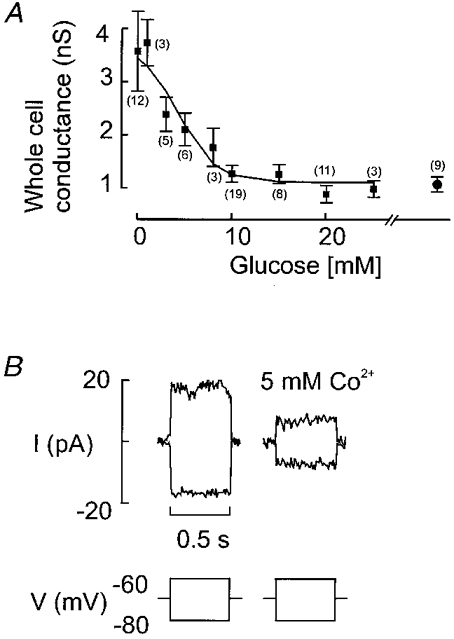
1. The perforated patch whole-cell configuration of the patch-clamp technique was applied to superficial cells in intact pancreatic islets. Immunostaining in combination with confocal microscopy revealed that the superficial cells consisted of 35 % insulin-secreting B-cells and 65 % non-B-cells (A- and D-cells). 2. Two types of cell, with distinct electrophysiological properties, could be functionally identified. One of these generated oscillatory electrical activity when the islet was exposed to 10 mM glucose and had the electrophysiological characteristics of isolated B-cells maintained in tissue culture. 3. The Ca2+ current recorded from B-cells in situ was 80 % larger than that of isolated B-cells. It exhibited significant (70 %) inactivation during 100 ms depolarisations. The inactivation was voltage dependent and particularly prominent during depolarisations evoking the largest Ca2+ currents. 4. Voltage-dependent K+ currents were observed during depolarisations to membrane potentials above -20 mV. These currents inactivated little during a 200 ms depolarisation and were unaffected by varying the holding potential between -90 and -30 mV. 5. The maximum resting conductance in the absence of glucose, which reflects the conductance of ATP-regulated K+ (KATP) channels, amounted to approximately 4 nS. Glucose produced a concentration-dependent reduction of KATP channel conductance with half-maximal inhibition observed with 5 mM glucose. 6. Combining voltage- and current-clamp recording allowed the estimation of the gap junction conductance between different B-cells. These experiments indicated that the input conductance of the B-cell at stimulatory glucose concentrations ( approximately 1 nS) is almost entirely accounted for by coupling to neighbouring B-cells.
Figures
References
-
- Ashcroft FM, Rorsman P. Electrophysiology of the pancreatic β-cell. Progress in Biophysics and Molecular Biology. 1989;54:87–143. - PubMed
-
- Barnett DW, Pressel DM, Misler S. Voltage-dependent Na+ and Ca2+ currents in human pancreatic islet β-cells: evidence for roles in the generation of action potentials and insulin secretion. Pflügers Archiv. 1995;431:272–282. - PubMed
-
- Dean PM, Matthews EK. Electrical activity in pancreatic islet cells. Nature. 1968;219:389–390. - PubMed
Publication types
MeSH terms
Substances
LinkOut - more resources
Full Text Sources
Other Literature Sources
Miscellaneous