. 1999 Dec;104(12):1703-14.
doi: 10.1172/JCI7605.

Cardiac hypertrophy with preserved contractile function after selective deletion of GLUT4 from the heart

Affiliations

Cardiac hypertrophy with preserved contractile function after selective deletion of GLUT4 from the heart

E D Abel et al. J Clin Invest. 1999 Dec.

Abstract

Glucose enters the heart via GLUT1 and GLUT4 glucose transporters. GLUT4-deficient mice develop striking cardiac hypertrophy and die prematurely. Whether their cardiac changes are caused primarily by GLUT4 deficiency in cardiomyocytes or by metabolic changes resulting from the absence of GLUT4 in skeletal muscle and adipose tissue is unclear. To determine the role of GLUT4 in the heart we used cre-loxP recombination to generate G4H(-/-) mice in which GLUT4 expression is abolished in the heart but is present in skeletal muscle and adipose tissue. Life span and serum concentrations of insulin, glucose, FFAs, lactate, and beta-hydroxybutyrate were normal. Basal cardiac glucose transport and GLUT1 expression were both increased approximately 3-fold in G4H(-/-) mice, but insulin-stimulated glucose uptake was abolished. G4H(-/-) mice develop modest cardiac hypertrophy associated with increased myocyte size and induction of atrial natriuretic and brain natriuretic peptide gene expression in the ventricles. Myocardial fibrosis did not occur. Basal and isoproterenol-stimulated isovolumic contractile performance was preserved. Thus, selective ablation of GLUT4 in the heart initiates a series of events that results in compensated cardiac hypertrophy.


Figures

Figure 1
Figure 1
Transgenic construct, gene targeting, and cardiac specificity of cre expression. (a) Targeting construct used to generate GLUT4 loxP mice. B represents BamHI restriction sites used in Southern blotting to identify targeted and wild-type alleles using the 5′ probe as shown. Other restriction sites shown: A, AccI; E, EcoRI; H, HindIII; S1, SacI; S2, SacII. Neo, neomycin selection marker. (b) Representative Southern blot revealing wild-type and targeted alleles in mice. + represents the wild-type allele (10 kb) and lox represents the loxP-containing allele (7 kb). (c) Northern blot of 15 μg of total RNA obtained from tissues of a cre transgenic mouse and probed with the cDNA for cre recombinase. Cre expression is cardiac-specific. 1, heart; 2, skeletal muscle; 3, brown adipose tissue; 4, white adipose tissue; 5, liver; 6, brain.
Figure 2
Figure 2
Glucose transporter expression. (a) Representative GLUT4 immunoblots of postnuclear membranes of cardiac muscle obtained from female (F) and male (M) wild-type (+/+) and heart-selective GLUT4-ablated (G4H–/–; cre lox/lox) mice (left) and female mice of other genotypes: loxP homozygotes (lox/lox) and loxP heterozygotes (+/lox) without cre (right). Similar data exist for males. (b) Representative GLUT1 immunoblots of postnuclear membranes of cardiac muscle from female G4H–/– (cre lox/lox) mice, loxP homozygotic (lox/lox) mice, heterozygotic (+/lox) mice, and wild-type (+/+) mice. Similar data exist for males. (c) Densitometric analysis of GLUT1 immunoblots obtained from male and female G4H–/– mice and their wild-type controls (aged 18–21 weeks). GLUT1 densities are normalized to 1 for both males and females.Males: wild-type, n = 19; G4H–/–, n = 7. Females: wild-type, n = 6; G4H–/–, n = 6. *P < 0.001 vs. wild-type controls (2-tailed t test). (d) Representative GLUT4 immunoblots (from 5 mice of each genotype) demonstrating the preservation of GLUT4 expression in postnuclear membranes of skeletal muscle of G4H–/– (cre lox/lox) mice and normal expression of GLUT4 in loxP homozygotes without cre (lox/lox). (e) Representative GLUT4 immunoblots (from 17 mice of each genotype) of postnuclear membranes from white adipose tissue of wild-type (+/+), loxP homozygotic (lox/lox), and G4H–/– (cre lox/lox) male and female mice. Each panel represents a separate immunoblot. The third panel shows that there is no further change in GLUT4 content in G4H–/– (cre lox/lox) mice compared with loxP homozygous (lox/lox) mice.
Figure 3
Figure 3
GTTs in awake G4H–/– mice (squares) and age-matched littermate controls (circles). Blood glucose concentrations at 0, 10, 20, 30, 60, and 120 minutes after intraperitoneal injection of glucose (1 mg/gram body weight). (a) Mean ± SEM for 28-week-old males (6 G4H–/– and 6 wild-type). (b) Mean ± SEM for 18-week-old females (7 G4H–/– and 15 wild-type) (left) and 30-week-old females (7 G4H–/– and 7 wild-type) (right). There are no statistical differences between wild-type and G4H–/– GTTs by repeated-measures ANOVA.
Figure 4
Figure 4
Evidence for impaired GLUT4-mediated glucose uptake in GLUT4-ablated hearts. (a) Representative 31P NMR spectra in wild-type and G4H–/– hearts, illustrating absence of insulin-mediated augmentation of 2-DG-P accumulation in GLUT4-deficient hearts. The decline in phosphocreatine (PCr) after insulin stimulation in wild-type mice probably represents transfer of phosphates to 2-DG-P. PPA, phenylphosphonic acid standard; Pi, inorganic phosphate. γ, α, and β represent the 3 phosphates on adenosine in ATP. (b) Basal and insulin-stimulated 2-DG uptake in wild-type and G4H–/– mice. Bars represent mean ± SEM; individual data points are illustrated by the closed circles. Number of animals in each group: Wild-type males: basal, n = 5; insulin-stimulated (Ins), n = 5. G4H–/– males: basal, n = 4; insulin-stimulated, n = 3. Wild-type females: basal, n = 5; insulin-stimulated, n = 5. G4H–/– females: basal, n = 5; insulin-stimulated, n = 5. *P < 0.05 vs. wild-type basal of either sex (ANOVA). ‡‡P < 0.0001, **P < 0.004 vs. wild-type basal of the same sex (paired 2-tailed t test).
Figure 5
Figure 5
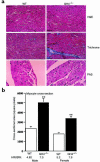
Cardiac histology. (a) Representative transverse sections of left ventricle stained with hematoxylin and eosin (H&E) (top row) and trichrome (middle row) of a wild-type and a G4H–/– female mouse (aged 30 weeks) illustrating the absence of gross morphological abnormalities of myocyte architecture and the absence of any increase in interstitial collagen. ×600 (original magnification). Representative periodic acid–Schiff (PAS) cross-sections (bottom row) taken from the left ventricle of a female G4H–/– mouse and an age-matched control (aged 20 weeks), illustrating the sections used for quantitative histomorphometry. Data are similar for males (not shown). (b) Quantitative histomorphometry of male and female G4H–/– and wild-type hearts (a single heart is represented for each). Heart weight to body weight ratios (HW/BW) are shown beneath each bar. Males: n = 28 cross-sections for wild-type mice and 27 cross-sections for G4H–/– mice. Females: n = 37 cross-sections for wild-type and 43 cross-sections for G4H–/–. **P < 0.0001 vs. wild-type of the same sex (unpaired 2-tailed t test).
Figure 6
Figure 6
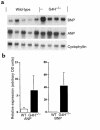
ANP and BNP gene expression. (a) Northern blot showing changes in the expression of ANP and BNP mRNA in wild-type (first 5 lanes) and G4H–/– mice (last 4 lanes). Data shown are from male mice 13–14 weeks of age. Thirty micrograms of total RNA was loaded in each lane. (b) Densitometric analysis of Northern blot data after correcting for loading with cyclophyllin. Note differences in the scales (y axis) of the ANP and BNP plots. P = 0.016 for wild-type BNP vs. G4H–/– BNP expression. P = 0.112 for wild-type ANP vs. G4H–/– ANP expression (Mann-Whitney U test 2-tailed probabilities). Wild-type: n = 5. G4H–/–: n = 4.
Figure 7
Figure 7
Isovolumic contractile performance in wild-type mice (open circles) and G4H–/– mice (closed circles) in response to 2 doses of isoproterenol as described in Methods. There are 5 animals (3 males and 2 females) in each group (32–40 weeks of age). Each G4H–/– mouse was paired with an age-matched wild-type control. LVDP, left ventricular developed pressure; EDP, end diastolic pressure; RPP, rate pressure product; +dP/dt, rate of contraction; –dP/dt, rate of relaxation.

References

    1. Taegtmeyer H. Energy metabolism of the heart: from basic concepts to clinical applications. Curr Probl Cardiol. 1994;19:57–116. - PubMed
    1. Gertz EW, Wisneski JA, Stanley WC, Neese RA. Myocardial substrate utilization during exercise in humans. Dual carbon-labeled carbohydrate isotope experiments. J Clin Invest. 1988;82:2017–2025. - PMC - PubMed
    1. Seymour AM, Eldar H, Radda GK. Hyperthyroidism results in increased glycolytic capacity in the rat heart. A 31P-NMR study. Biochim Biophys Acta. 1990;1055:107–116. - PubMed
    1. Opie LH. Myocardial ischemia—metabolic pathways and implications of increased glycolysis. Cardiovasc Drugs Ther. 1990;4:777–790. - PubMed
    1. Owen P, Dennis S, Opie LH. Glucose flux rate regulates onset of ischemic contracture in globally underperfused rat hearts. Circ Res. 1990;66:344–354. - PubMed

Publication types