. 2000 Jan 15;28(2):489-97.
doi: 10.1093/nar/28.2.489.

RNA aptamers for the MS2 bacteriophage coat protein and the wild-type RNA operator have similar solution behaviour

Affiliations

RNA aptamers for the MS2 bacteriophage coat protein and the wild-type RNA operator have similar solution behaviour

A M Parrott et al. Nucleic Acids Res. .

Abstract

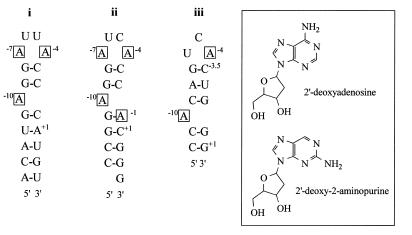
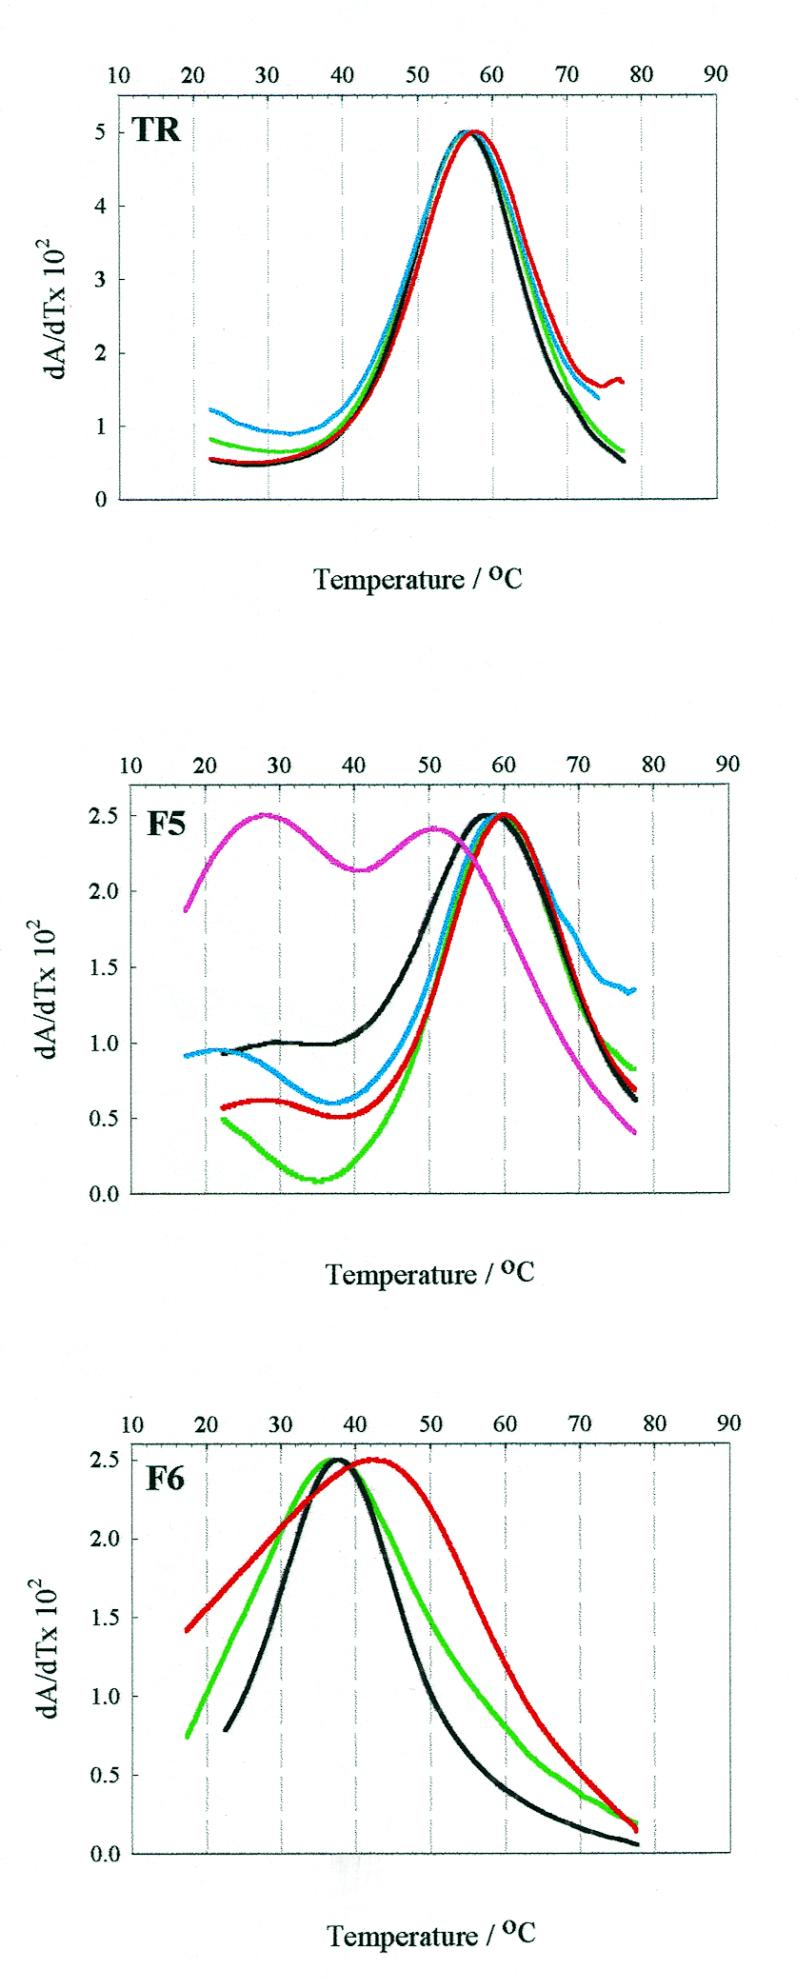
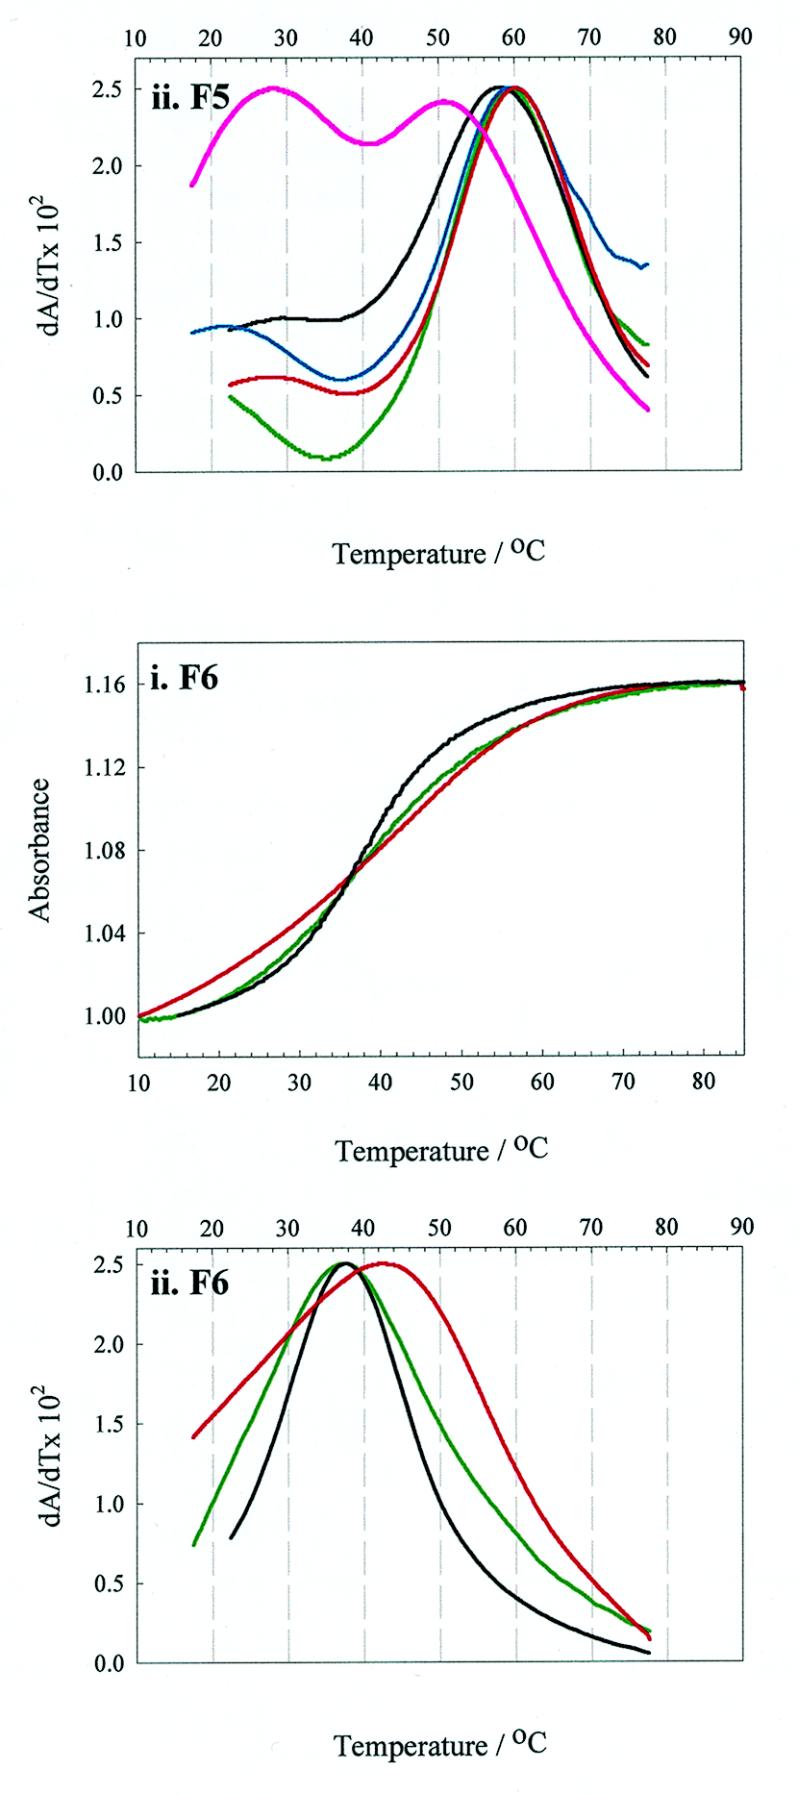
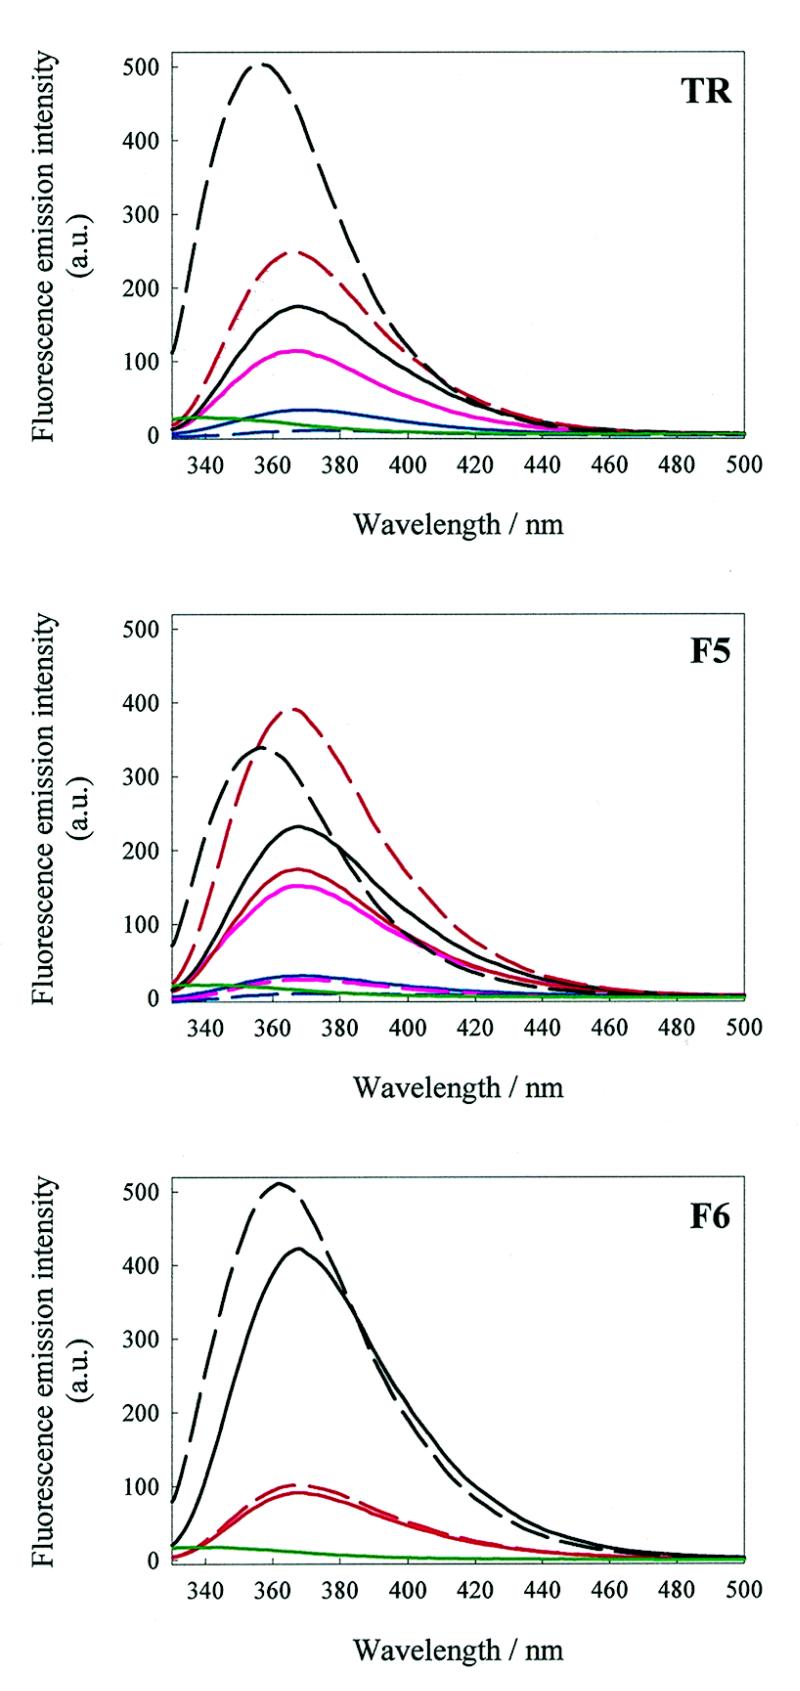
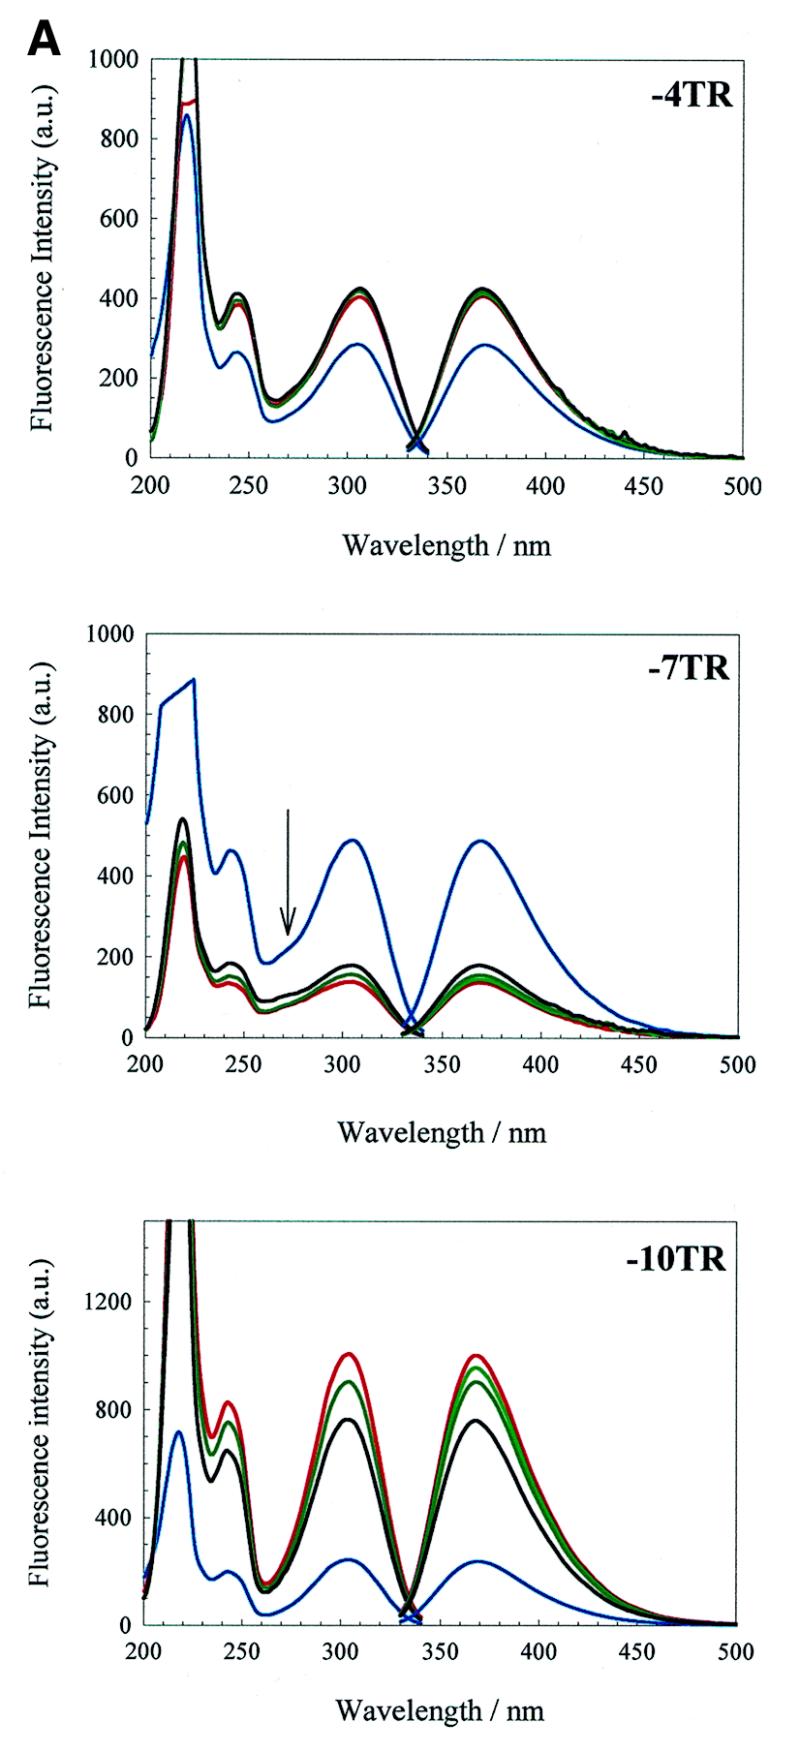
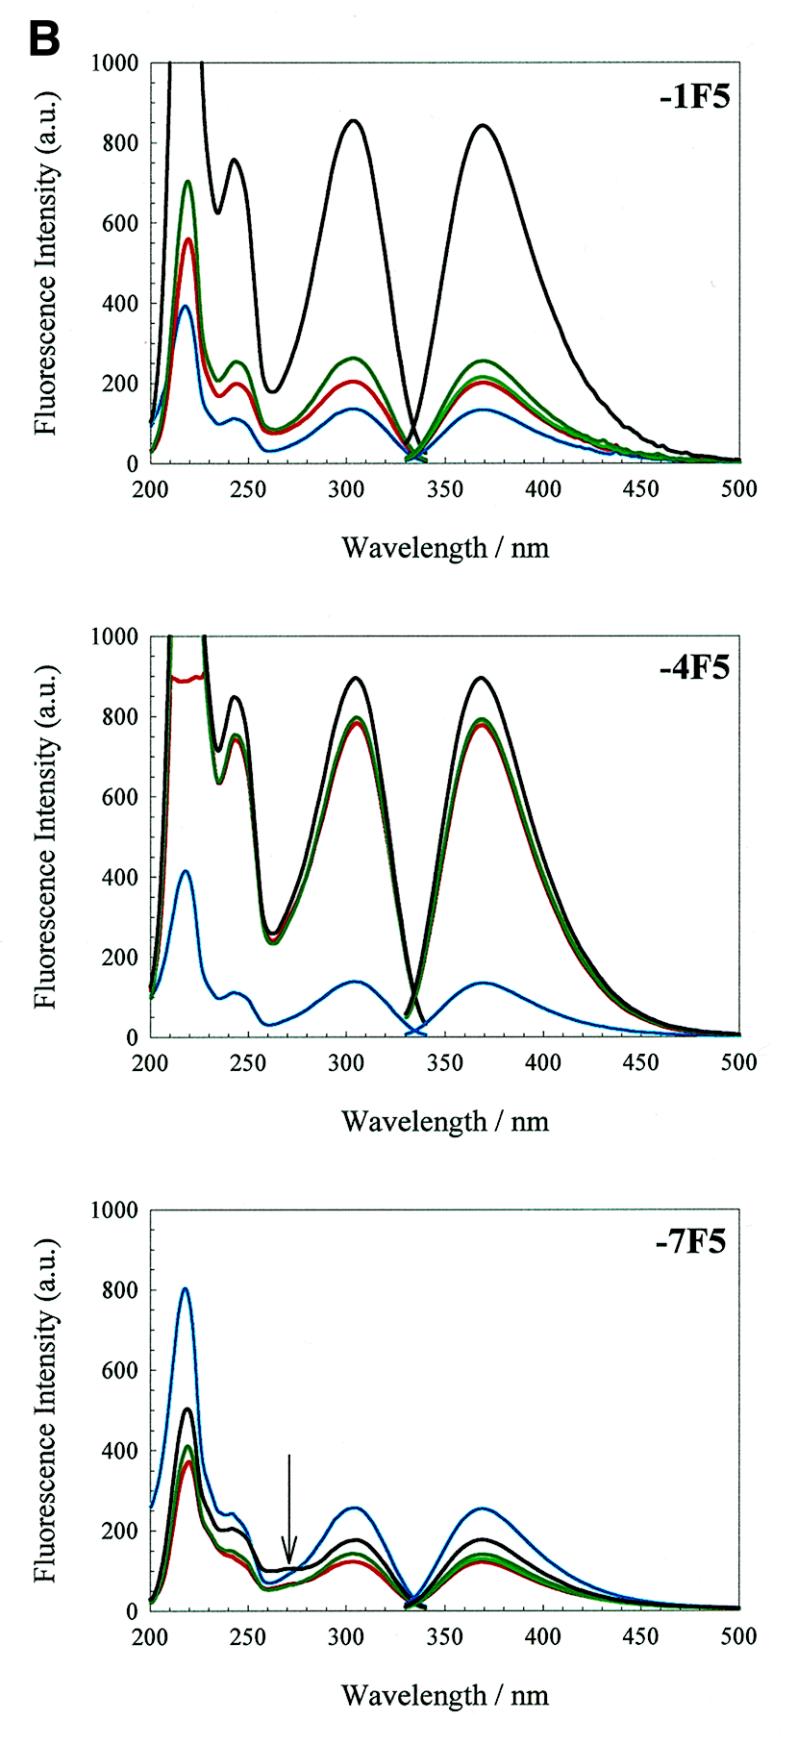
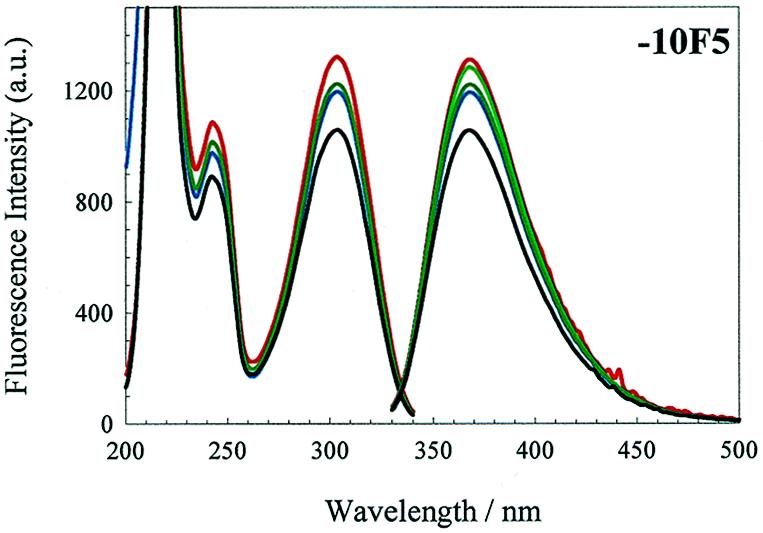
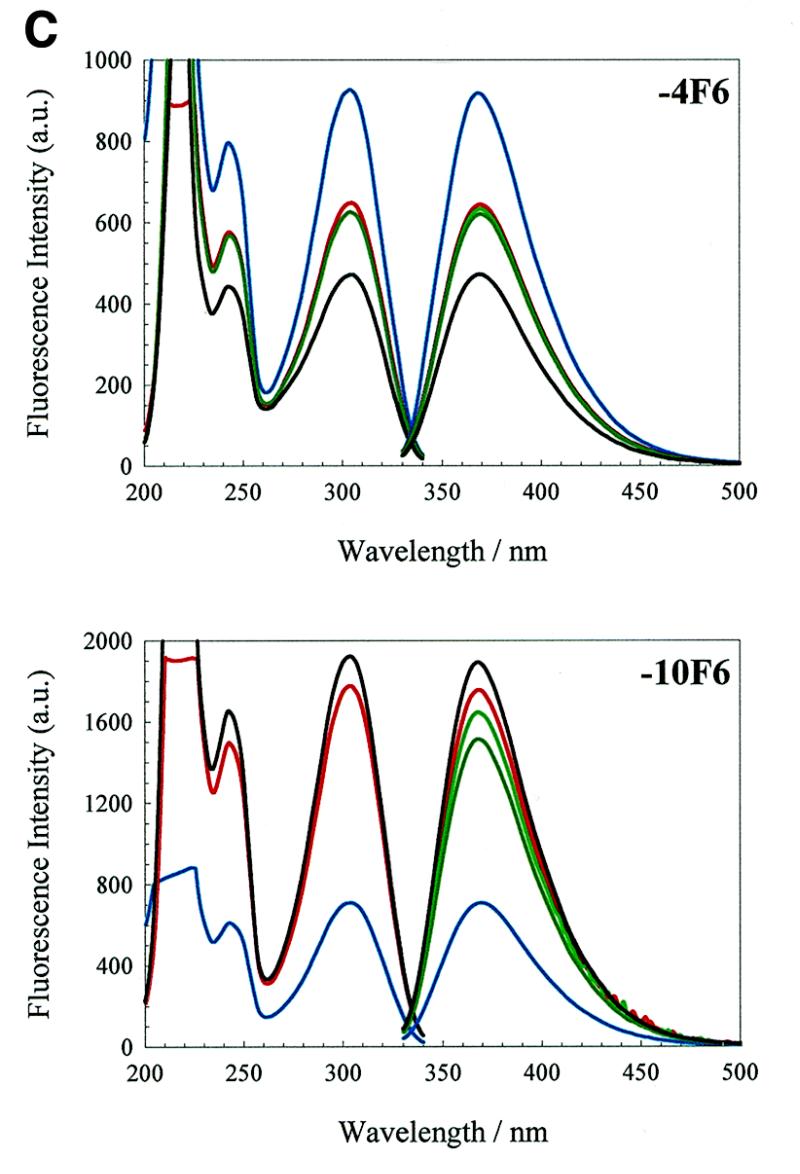
We have probed the effects of altering buffer conditions on the behaviour of two aptamer RNAs for the bacterio-phage MS2 coat protein using site-specific substitution of 2'-deoxy-2-aminopurine nucleotides at key adenosine positions. These have been compared to the wild-type operator stem-loop oligonucleotide, which is the natural target for the coat protein. The fluorescence emission spectra show a position and oligonucleotide sequence dependence which appears to reflect local conformational changes. These are largely similar between the differing oligonucleotides and deviations can be explained by the individual features of each sequence. Recognition by coat protein is enhanced, unaffected or decreased depending on the site of substitution, consistent with the known protein-RNA contacts seen in crystal structures of the complexes. These data suggest that the detailed conformational dynamics of aptamers and wild-type RNA ligands for the same protein target are remarkably similar.


Figures

Figure 1
Figure 1
Secondary structures of RNA fragments used. Sequences and secondary structures of RNA stem–loops that bind to MS2 coat protein. Base numbering is relative to the start of the MS2 replicase initiation codon +1. All sites of 2AP substitution are highlighted in boxes. (i) Sequence of the wild-type operator; (ii) consensus sequence of the F5 aptamer family (the secondary structure shown is based on the X-ray crystal structure of the protein complex; 16); (iii) consensus sequence of the F6 aptamer sequence. Note that in order to compare base positions easily the cytidine of the additional base pair between the loop and the A–10 position of the F6 aptamer is labelled –3.5. (Inset) Structures of 2′-deoxyadenosine ribonucleoside and 2AP ribonucleoside.
Figure 2
Figure 2
Thermal denaturation curves of the unmodified RNAs and their 2AP derivatives. Melting curves of unmodified and 2AP derivatised wild-type operator (TR) and the F5 and F6 aptamers. Green lines represent unmodified RNA, whilst red, blue and black lines denote 2AP substitution at positions –4, –7 and –10, respectively. The pink line represents the –1F5 derivative. The figure shows the first derivative plots from which the Tm values were determined.
Figure 2
Figure 2
Thermal denaturation curves of the unmodified RNAs and their 2AP derivatives. Melting curves of unmodified and 2AP derivatised wild-type operator (TR) and the F5 and F6 aptamers. Green lines represent unmodified RNA, whilst red, blue and black lines denote 2AP substitution at positions –4, –7 and –10, respectively. The pink line represents the –1F5 derivative. The figure shows the first derivative plots from which the Tm values were determined.
Figure 3
Figure 3
Fluorescence emission spectra of bound and unbound RNA fragments. Fluorescence emission spectra of 0.3 µM 2AP derivatised RNAs in TMK buffer, pH 7.5, in the presence and absence of a saturating concentration of MS2 coat protein (1 µM, dimer). Spectral bandwidths were 3 (excitation) and 8 nm (emission) and the excitation wavelength was set at 306 nm. Red, blue and black lines denote fluorescence emission from 2AP substituted at positions –4, –7 and –10, respectively. The pink line represents the uncomplexed aptamer –1F5 derivative and the green line represents the free coat protein fluorescence. Dashed lines represent the fluorescence emission of the corresponding coat protein:operator complexes.
Figure 4
Figure 4
Fluorescence spectra of 2AP nucleotide and an unfolded, substituted oligonucleotide. (A) Fluorescence excitation and emission spectra of 0.5 µM 2′-deoxy-2-aminopurine-3′,5′-diphosphate mononucleotide. An aqueous solution (blue) of the nucleotide, pH ~5.5, in a 1.5 ml stirred luminescence cuvette was converted to TMK buffer, pH 7.5, by consecutive addition of buffer components. First, Tris, pH 7.5, was added to a concentration of 100 mM (red), then KCl to concentrations of 5, 10, 20 (light green), 40 and 80 mM (dark green), and finally MgCl2 (black) to a concentration of 10 mM. Instrument parameters were as in Materials and Methods, apart from the spectral bandwidths, which were set at 5 (excitation) and 6.5 nm (emission). (B) Temperature dependence of the fluorescence emission spectrum of the 2AP derivative –7TR. The emission spectra are shown of 0.5 µM –7TR in water or in TMK buffer, pH 7.5, at 25 (blue) and 75°C (red). Solid and dashed lines represent fluorescence emission in water and TMK, respectively. The 75°C curves are superimposed. Fluorescence measurements were taken using a Photon Technology International (PTI) spectrofluorimeter controlled by the programme FeliX, fitted with a PE60 Linkam thermo-controller and PTI temperature sensor accessory. Emission spectra were scanned from 330 to 500 nm at 240 nm min–1, exciting at 306 nm. Spectra were generated from an average of three scans and the baseline subtracted.
Figure 5
Figure 5
(Opposite and above) Effects of changing solution conditions on the fluorescence emission spectra. Fluorescence excitation and emission spectra of the 2AP derivatives of the wild-type operator and the F5 and F6 aptamers. Note that the 270 nm band is highlighted with an arrow in the –7TR and –7F5 excitation spectra. An aqueous solution of 0.3 µM 2AP derivatised operator, pH 5.2, in a 1.5 ml stirred luminescence cuvette was converted to TMK buffer, pH 7.5, by consecutive addition of buffer components. The colour code is as in Figure 4A.
Figure 5
Figure 5
(Opposite and above) Effects of changing solution conditions on the fluorescence emission spectra. Fluorescence excitation and emission spectra of the 2AP derivatives of the wild-type operator and the F5 and F6 aptamers. Note that the 270 nm band is highlighted with an arrow in the –7TR and –7F5 excitation spectra. An aqueous solution of 0.3 µM 2AP derivatised operator, pH 5.2, in a 1.5 ml stirred luminescence cuvette was converted to TMK buffer, pH 7.5, by consecutive addition of buffer components. The colour code is as in Figure 4A.

References

    1. Witherall G.W., Gott,J.M. and Uhlenbeck,O.C. (1991) Prog. Nucleic Acid Res. Mol. Biol., 40, 185–220. - PubMed
    1. Stockley P.G., Stonehouse,N.J., Murray,J.B., Goodman,S.T.S., Talbot,S.J., Adams,C.J., Liljas,L. and Valegård,K. (1995) Nucleic Acids Res., 23, 2512–2518. - PMC - PubMed
    1. Talbot S.J., Goodman,S., Bates,S.R.E., Fishwick,C.W.G. and Stockley,P.G. (1990) Nucleic Acids Res., 18, 3521–3528. - PMC - PubMed
    1. Borer P.N., Lin,Y., Wang,S., Roggenbuck,M.W., Gott,J.M., Uhlenbeck,O.C. and Pelczer,I. (1995) Biochemistry, 34, 6488–6503. - PubMed
    1. Nooren I.M.A., Wang,K.Y., Borer,P.N. and Pelczer,I. (1998) J. Biomol. NMR, 11, 319–328. - PubMed

Publication types