. 2000 Jan;119(1):115-22.
doi: 10.1046/j.1365-2249.2000.01102.x.

Adrenaline-induced mobilization of T cells in HIV-infected patients

Affiliations

Adrenaline-induced mobilization of T cells in HIV-infected patients

S R Søndergaard et al. Clin Exp Immunol. 2000 Jan.

Abstract

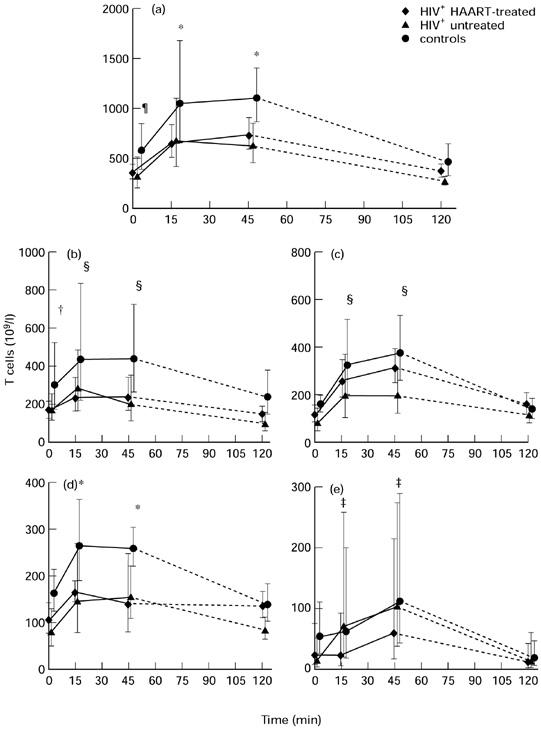
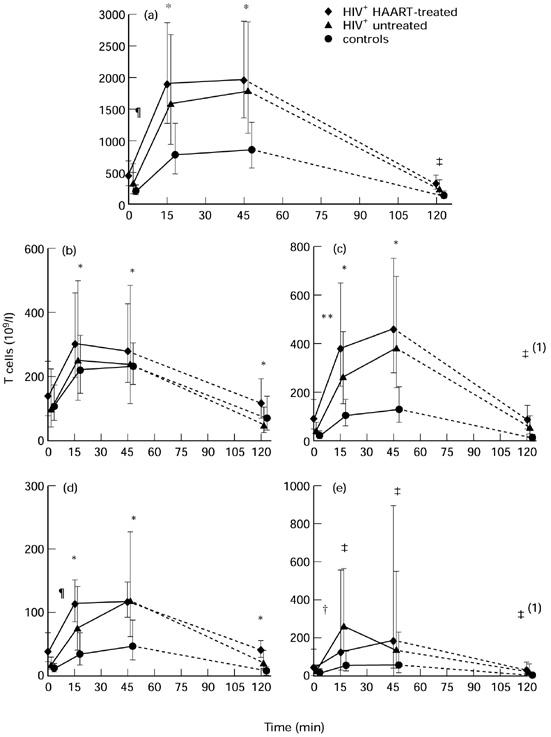
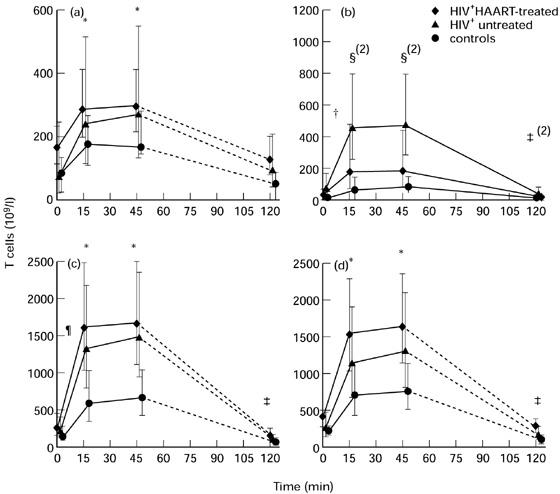
The present study aimed to investigate lymphocyte mobilization from peripheral cell reservoirs in HIV-infected patients. Nine HIV-infected patients on stable highly active anti-retroviral therapy (HAART), eight treatment-naive HIV-infected patients and eight HIV- controls received a 1-h adrenaline infusion. The adrenaline infusion induced a three-fold increase in the concentration of lymphocytes in all three groups. All HIV-infected patients mobilized significantly higher numbers of CD8+ cells but less CD4+ cells. All subjects mobilized CD45RA+CD62L+ and CD8+CD28+ cells to a lesser extent than CD45RO+CD45RA- and CD8+CD28-cells. Furthermore, high numbers of CD8+CD38+ cells were mobilized only in the HIV-infected patients. It was therefore predominantly T cells with an activated phenotype which were mobilized after adrenaline stimulation. It is concluded that the HIV-associated immune defect induced an impaired ability to mobilize immune-competent cells in response to stress stimuli. Furthermore, the study does not support the idea that CD4+ T cells are trapped in lymph nodes by HIV antigens, because untreated and HAART-treated HIV-infected patients mobilized similar numbers of CD4+ T cells. Finally, no evidence was found for the existence of a HAART-induced non-circulating pool of CD4+ T cells.


Figures

Fig. 1
Fig. 1
Blood concentrations of CD4+ T cell subpopulations (cells/mm3) before, during and after adrenaline infusion. Geographic mean and 95% confidence interval error bars are shown. Untreated (n = 8) and highly active anti-retroviral therapy (HAART)-treated (n = 9) HIV-infected patients and controls (n = 8). (a) CD4+ T cells. (b) CD4+CD45RA+CD62L+ (naive) T cells. (c) CD4+CD45RO+ (memory) T cells. (d) CD4+CD45RA+CD62L (revertant) T cells. (e) CD4+CD45RA+CD45RO+ (transient) T cells. ‡, §, * denote significant difference from baseline values, P < 0.05, P < 0.01 and P < 0.001, respectively; †, ¶ denote significant difference between the HIV-infected group and controls, P < 0.05 and P < 0.01, respectively.
Fig. 2
Fig. 2
Blood concentrations of CD8+ T cell subpopulations (cells/mm3) before, during and after adrenaline infusion. Geographic mean and 95% confidence interval error bars are shown. Untreated (n = 8) and highly active anti-retroviral therapy (HAART)-treated (n = 9) HIV-infected patients and controls (n = 8). (a) CD8+ T cells. (b) CD8+CD45RA+CD62L+ (naive) T cells. (c) CD8+CD45RO+ (memory) T cells. (d) CD8+CD45RA+CD62L (revertant) T cells. (e) CD8+CD45RA+CD45RO+ (transient) T cells. ‡, * denote significant difference from baseline values, P < 0.05 and P < 0.001 (‡(1) only in the controls), respectively; †, ¶, ** denote significant differences between the HIV-infected group and the controls, P < 0.05, P < 0.01 and P < 0.001, respectively.
Fig. 3
Fig. 3
Blood concentrations of CD8+ T cell subpopulations co-expressing CD28 or CD38 (cells/mm3) before, during and after adrenaline infusion. Geographic mean and 95% confidence interval error bars are shown. Untreated (n = 8) and highly active anti-retroviral therapy (HAART)-treated (n = 9) HIV-infected patients and controls (n = 8). (a) CD8+CD28+ T cells. (b) CD8+CD38+ T cells. (c) CD8+CD28 T cells. (d) CD8+CD38 T cells. ‡, §, * denote significant differences from baseline values, P < 0.05, P < 0.01 and P < 0.001 (‡(2) and §(2), only in the HIV-infected group), respectively; †, ¶ denote group effect between the HIV-infected group and the controls, P < 0.05 and P < 0.01, respectively.

Similar articles

Cited by

References

    1. Fauci AS, Pantaleo G, Stanley S, Weissman D. Immunopathogenic mechanisms of HIV infection. Ann Intern Med. 1996;124:654–63. - PubMed
    1. Miedema F. Immunological abnormalities in the natural history of HIV infection: mechanisms and clinical relevance. Immunodefic Rev. 1992;3:173–93. - PubMed
    1. Sachsenberg N, Perelson AS, Yerly S, Schockmel GA, Leduc D, Hirschel B, Perrin L. Turnover of CD4+ and CD8+ T lymphocytes in HIV-1 infection as measured by Ki-67 antigen. J Exp Med. 1998;187:1295–303. - PMC - PubMed
    1. Ho DD, Neumann AU, Perelson AS, Chen W, Leonard JM, Markowitz M. Rapid turnover of plasma virions and CD4 lymphocytes in HIV-1 infection. Nature. 1995;373:123–6. - PubMed
    1. Wei X, Ghosh SK, Taylor ME, et al. Viral dynamics in human immunedefiency virus type 1 infection. Nature. 1995;373:117–22. - PubMed

Publication types

MeSH terms