. 2000 Jan;20(2):634-47.
doi: 10.1128/MCB.20.2.634-647.2000.

Inhibition of TATA-binding protein function by SAGA subunits Spt3 and Spt8 at Gcn4-activated promoters

Affiliations

Inhibition of TATA-binding protein function by SAGA subunits Spt3 and Spt8 at Gcn4-activated promoters

R Belotserkovskaya et al. Mol Cell Biol. 2000 Jan.

Abstract

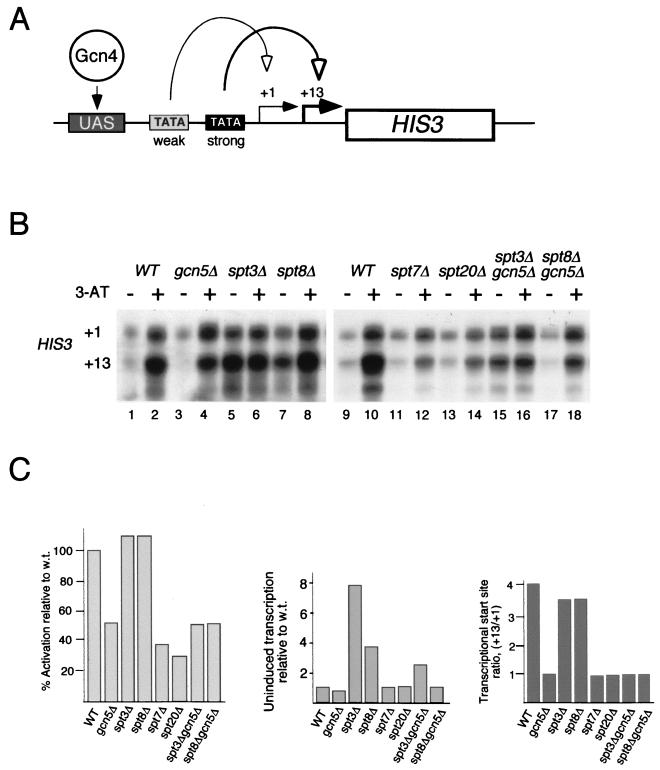
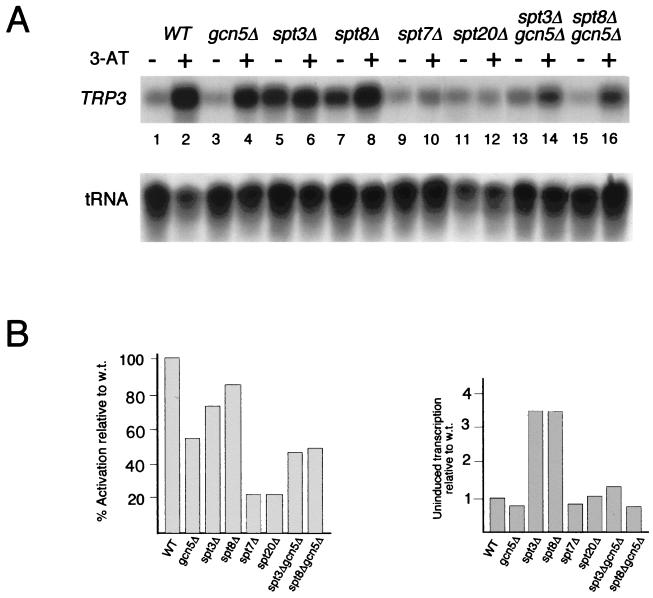
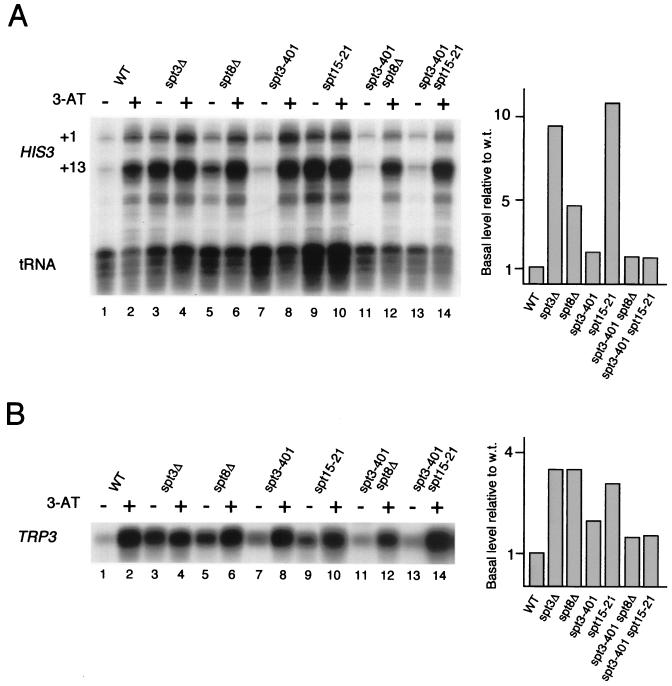
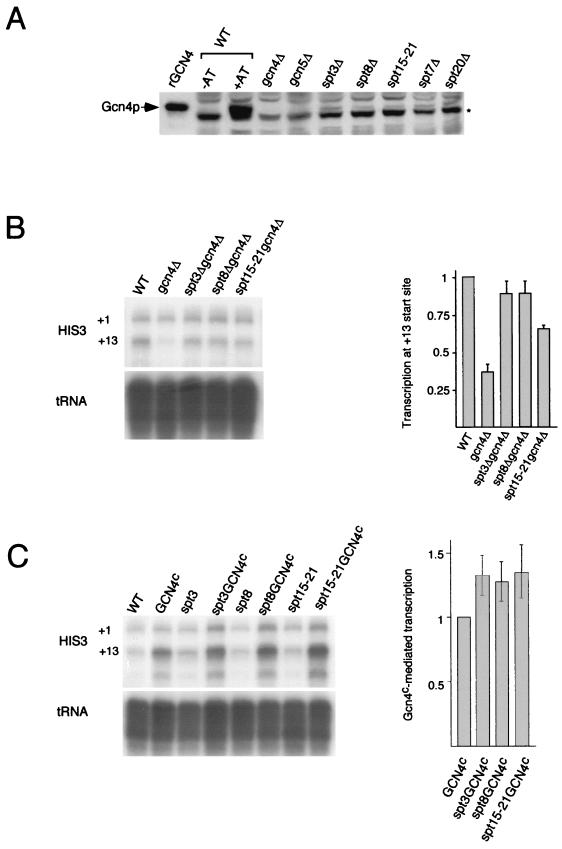
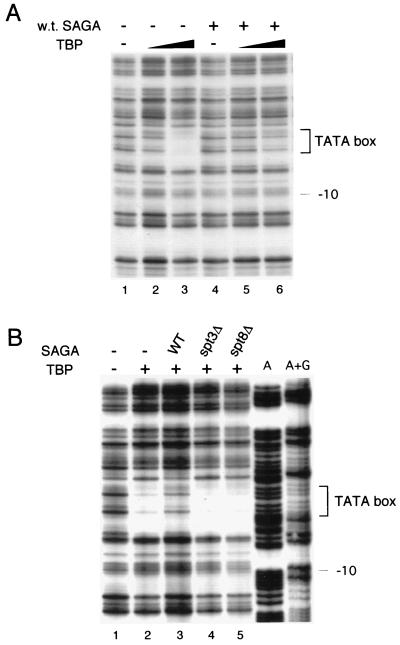
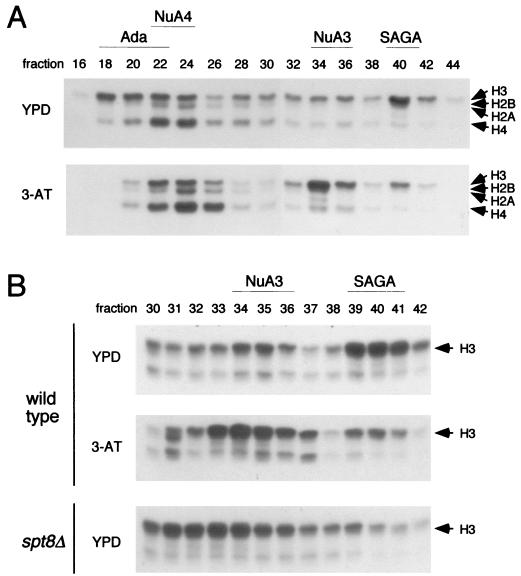
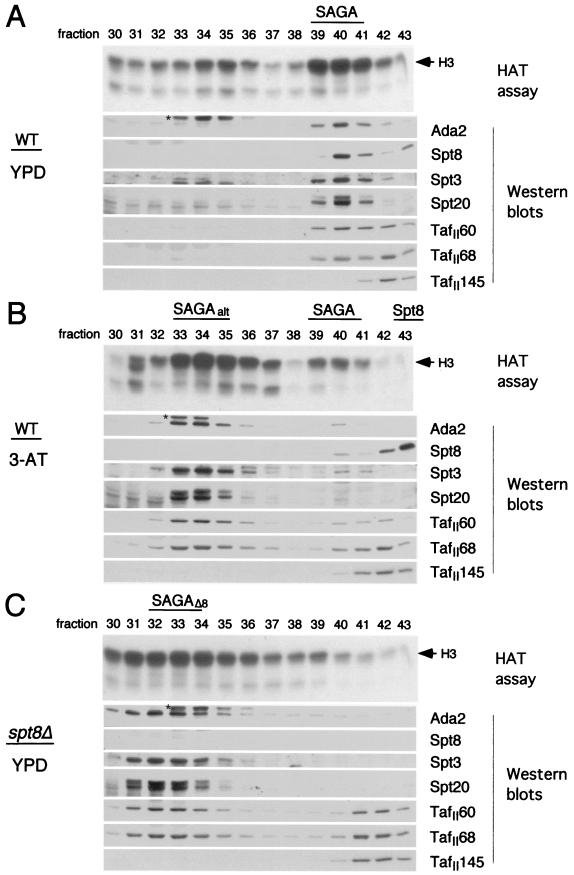
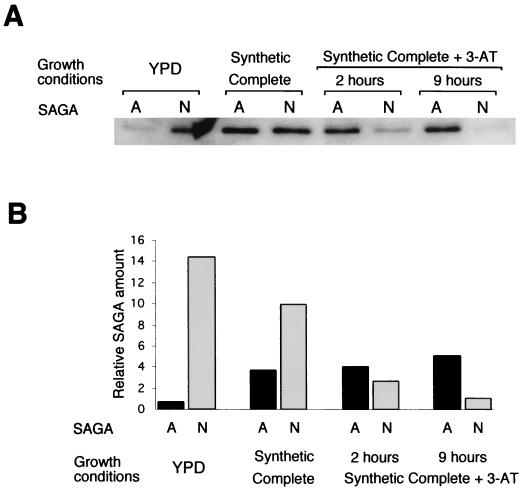
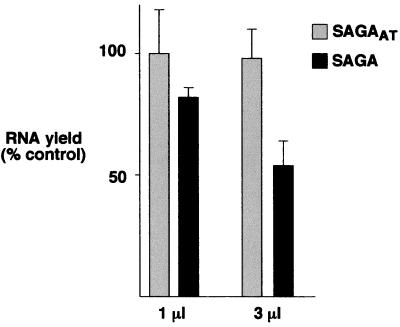
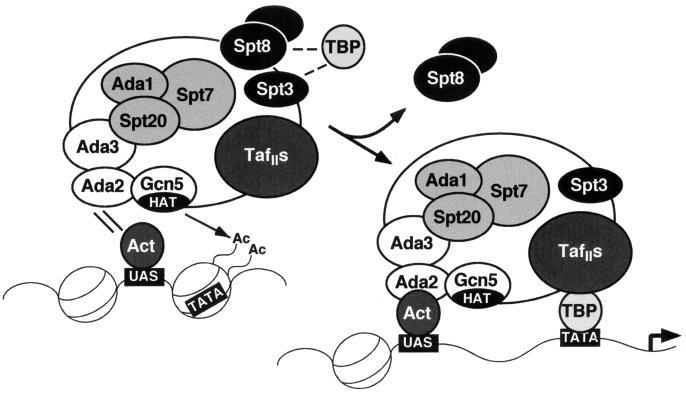
SAGA is a 1.8-MDa yeast protein complex that is composed of several distinct classes of transcription-related factors, including the adaptor/acetyltransferase Gcn5, Spt proteins, and a subset of TBP-associated factors. Our results indicate that mutations that completely disrupt SAGA (deletions of SPT7 or SPT20) strongly reduce transcriptional activation at the HIS3 and TRP3 genes and that Gcn5 is required for normal HIS3 transcriptional start site selection. Surprisingly, mutations in Spt proteins involved in the SAGA-TBP interaction (Spt3 and Spt8) cause derepression of HIS3 and TRP3 transcription in the uninduced state. Consistent with this finding, wild-type SAGA inhibits TBP binding to the HIS3 promoter in vitro, while SAGA lacking Spt3 or Spt8 is not inhibitory. We detected two distinct forms of SAGA in cell extracts and, strikingly, one lacks Spt8. Conditions that induce HIS3 and TRP3 transcription result in an altered balance between these complexes strongly in favor of the form without Spt8. These results suggest that the composition of SAGA may be dynamic in vivo and may be regulated through dissociable inhibitory subunits.


Figures

FIG. 1
FIG. 1
Effects of SAGA subunit deletions on uninduced and activated transcription of the HIS3 gene. (A) Model of HIS3 gene function. Two transcriptional start sites, +1 and +13, are used. Under noninducing conditions, similar levels of +1 and +13 transcripts are produced. The +13 transcripts are more abundant under activated conditions, as +13 transcription is directed from a strong TATA box influenced by the activator Gcn4 when it is bound to an upstream activating sequence (UAS). +1 transcription is much less Gcn4 dependent and is due to a weaker TATA box located upstream of the stronger one. (B) Detection of HIS3 transcripts in wild-type (WT) and various SAGA mutant strains. Gene expression was analyzed by an S1 nuclease protection assay. tRNAW levels were used as a control for intact RNA (see Fig. 2A). RNA was prepared from yeast cells grown in SC medium with (+) or without (−) 3-AT added. (C) PhosphorImager analyses of S1 nuclease assays presented as activated transcription relative to that of the wild type (w.t.) (left), uninduced transcription relative to that of the w.t. (middle), and the +13/+1 transcriptional start site ratio (right). Experiments were repeated at least three times, and PhosphorImager quantitation showed less than 20% error.
FIG. 2
FIG. 2
Effects of SAGA mutations on uninduced and activated transcription of the TRP3 gene. (A) Detection of TRP3 transcripts in wild-type (WT) and various SAGA mutant strains. Gene expression was analyzed by an S1 nuclease protection assay. tRNAW levels were used as a control for intact RNA. Growth conditions were the same as those described in the legend to Fig. 1. (B) PhosphorImager quantitation of S1 nuclease assays presented as described in the legend to Fig. 1C. Experiments were repeated at least three times, and PhosphorImager quantitation showed less than 20% error.
FIG. 3
FIG. 3
Functional interaction of Spt3 with Spt8 and TBP in HIS3 and TRP3 transcription. (A) S1 nuclease analysis of HIS3 expression in wild-type (WT) cells, SPT3 and SPT8 deletion mutants, specific SPT3 (spt3-401) and TBP (spt15-21) point mutants, and combinations thereof. The bar graph at right presents PhosphorImager quantitation of the S1 nuclease assays as uninduced transcription (without 3-AT) relative to the wild-type (w.t.) level. tRNAW levels were used as a control for intact RNA. (B) Equivalent set of assays for TRP3. RNA was isolated from yeast cells grown in SC medium with (+) or without (−) 3-AT added.
FIG. 4
FIG. 4
Analysis of the role of the activator Gcn4 in the high levels of uninduced transcription detected in spt3, spt8, and TBP mutant strains. (A) Western blot analysis of the Gcn4 protein level in the wild-type (WT) strain under noninducing (SC medium) and inducing (SC medium plus 3-AT) conditions and in spt mutant strains. The levels of Gcn4 protein were similar in all strains under noninducing conditions (−AT) and were much lower than those under inducing (+AT) conditions. The asterisk indicates a nonspecific background band which was present in all samples and which exhibited slightly faster mobility than Gcn4, as is clear from the gcn4Δ lane. Bacterially expressed recombinant Gcn4 (rGCN4) is also shown. (B) S1 nuclease analysis of the effect of spt3Δ, spt8Δ, and spt15-21 mutations on HIS3 transcription in the absence of Gcn4, i.e., in a gcn4Δ background. Transcription from the +13 start site was greatly reduced in the gcn4Δ mutant but not in the spt3Δ gcn4Δ, spt8Δ gcn4Δ, and spt15-21 gcn4Δ double mutants, as shown in the quantitative bar graph. RNA was isolated from yeast cells grown in SC medium. (C) S1 nuclease analysis of the effect of high levels of constitutive (superscript c) expression of the Gcn4 activator on HIS3 transcription under rich-medium (YPD) conditions. Overexpression of the Gcn4 protein resulted in increased HIS3 transcription, which was increased further in either spt3Δ, spt8Δ, or spt15-21 strains, as shown in the quantitative bar graph. Error bars in panels B and C show standard deviations. tRNAW levels were used as a control for intact RNA (panels B and C).
FIG. 5
FIG. 5
DNase I footprinting analysis of the effect of SAGA on TBP binding to the HIS3 TATA box in vitro. (A) DNase I protection of the consensus TATA box region (brackets) was assayed in the presence and absence (−) of recombinant TBP and the native SAGA complex purified from wild-type (w.t.) cells. TBP concentrations were 6 ng in lanes 2 and 5 and 18 ng in lanes 3 and 6. (B) Comparison of TBP footprints developed in the presence of either wild-type (WT) SAGA or SAGA isolated from spt3Δ or spt8Δ yeast strains. The amounts of SAGA were normalized by Western analysis. Binding reaction mixtures contained 18 ng of TBP. Lanes labelled A and A+G indicate sequencing reactions used to determine the footprint locations.
FIG. 6
FIG. 6
Comparison of HAT activity profiles under conditions inducing and noninducing for HIS3 and TRP3. HAT complexes were prepared by the previously described two-step fractionation of yeast extracts over Ni2+-agarose and Mono Q columns (22). (A) Fluorograph of free histone acetylation assays with even-numbered Mono Q fractions derived from wild-type cells grown under conditions repressive (YPD) or inducing (3-AT) for HIS3 transcription. Arrows denote relative positions of the core histones. Indicated at the top are the fractions containing the four distinct HAT complexes identified previously from wild-type yeast by the established purification procedure (see the text). (B) Pattern of free HAT activity in Mono Q fractions 30 to 42 from the fractionation described in panel A and from an spt8Δ strain grown in YPD medium.
FIG. 7
FIG. 7
Subunit analysis of SAGA under conditions of HIS3 and TRP3 repression or induction or in the presence of spt8Δ. Mono Q fractions used (30 to 43) are from the purifications described in the legend to Fig. 6; the HAT profiles, as determined in Fig. 6B, are presented at the top of each section. (A) Western blot analysis of wild-type (WT) SAGA from a HIS3-repressed culture (YPD medium) of strain SB327 containing c-myc epitope-tagged Spt8. Antibodies used were specific for c-myc (for Spt8 visualization), for the other SAGA subunits indicated, or for TAFII145 (not a component of SAGA). On the anti-Ada2 blot, an asterisk indicates an artifactual cross-reactive species. (B) Western analysis of SAGA from the same wild-type strain under HIS3-inducing conditions (3-AT). Designated above the panels are the predominant form of SAGA (SAGAalt), wild-type SAGA, and a novel species containing the majority of Spt8. (C) Western analysis of SAGA from spt8Δ strain FY463. The complex, chromatographically shifted relative to wild-type SAGA, is designated SAGAΔ8. The blot labelled Spt8 was visualized with anti-c-myc antibodies as a control for panels A and B. In all panels, a TAF-containing, TFIID-related peak independent of SAGA is present in fractions 41 and 42.
FIG. 8
FIG. 8
Analysis of SAGA and SAGAalt under different growth conditions. (A) Quantitative Western analysis of the peak SAGA (N) and SAGAalt (A) fractions from fractionation of yeasts grown in YPD medium, SC medium, and SC medium with 3-AT added for either 2 or 9 h. Anti-Ada2 antibody and 125I-protein A were used for immunoblot detection. (B) Relative amounts of complexes determined by normalizing the 125I-Ada2-specific signal from panel A through quantitation on a PhosphorImager to the protein concentration of the corresponding fraction.
FIG. 9
FIG. 9
Effects of SAGA and SAGAalt on basal transcription in vitro. Two forms of the SAGA complex (SAGA and SAGAalt [SAGAAT]) were purified as described by Grant et al. (23) to near homogeneity, and their effects were tested in in vitro transcription assays containing plasmid template pMLG (adenovirus major late promoter fused to a 400-bp G-less cassette) and either native (holo-PolII, TFIIF, and TFIIH) or recombinant (TBP and TFIIB) yeast general transcription factors. The results presented summarize six independent experiments. Error bars indicate standard deviations.
FIG. 10
FIG. 10
Model of SAGA complex function during transcriptional activation. (Left) Under noninducing conditions, specific components of SAGA, Spt3 and Spt8, down-regulate TBP function. Under inducing conditions, the SAGA complex is targeted to promoters of certain genes (e.g., HIS3 or TRP3) through interaction of its Ada2 subunit with an acidic activator (Act), such as Gcn4, bound to an upstream activation sequence (UAS). The HAT activity of Gcn5 acetylates (Ac) the histone tails of a nucleosome, destabilizing it and perhaps making a TATA box available for binding. (Right) In full activation, Spt8 is dissociated from the SAGA complex, and TBP-TATA binding is assisted by TAFIIs within SAGA.

References

    1. Ausubel F M, Brent R, Kingston R E, Moore D D, Seidman J G, Smith J A, Struhl K. Current protocols in molecular biology. New York, N.Y: John Wiley & Sons, Inc.; 1994.
    1. Bannister A J, Kouzarides T. The CBP co-activator is a histone acetyltransferase. Nature. 1996;384:641–643. - PubMed
    1. Barlev N A, Candau R, Wang L, Darpino P, Silverman N, Berger S L. Characterization of physical interactions of the putative transcriptional adaptor, ADA2, with acidic activation domains and TATA-binding protein. J Biol Chem. 1995;270:19337–19344. - PubMed
    1. Berger S L, Piña B, Silverman N, Marcus G A, Agapite J, Regier J L, Triezenberg S J, Guarente L. Genetic isolation of ADA2: a potential transcriptional adaptor required for function of certain acidic activation domains. Cell. 1992;70:251–265. - PubMed
    1. Birck C, Poch O, Romier C, Ruff M, Mengus G, Lavigne A-C, Davidson I, Moras D. Human TAFII28 and TAFII18 interact through a canonical histone fold encoded by atypical evolutionary conserved sequence motifs also found in the SPT3 TAFII family. Cell. 1998;94:239–249. - PubMed

Publication types

MeSH terms

Substances