

Dissociation of HIV-1 from follicular dendritic cells during HAART: mathematical analysis
- PMID: 10611272
- PMCID: PMC24707
- DOI: 10.1073/pnas.96.26.14681
Dissociation of HIV-1 from follicular dendritic cells during HAART: mathematical analysis
Abstract
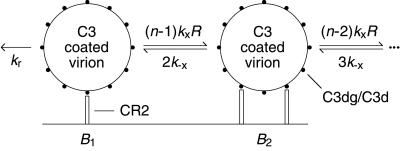
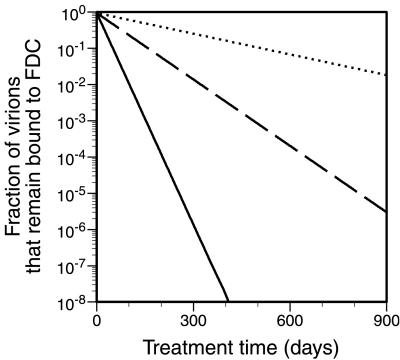
Follicular dendritic cells (FDC) provide a reservoir for HIV type 1 (HIV-1) that may reignite infection if highly active antiretroviral therapy (HAART) is withdrawn before virus on FDC is cleared. To estimate the treatment time required to eliminate HIV-1 on FDC, we develop deterministic and stochastic models for the reversible binding of HIV-1 to FDC via ligand-receptor interactions and examine the consequences of reducing the virus available for binding to FDC. Analysis of these models shows that the rate at which HIV-1 dissociates from FDC during HAART is biphasic, with an initial period of rapid decay followed by a period of slower exponential decay. The speed of the slower second stage of dissociation and the treatment time required to eradicate the FDC reservoir of HIV-1 are insensitive to the number of virions bound and their degree of attachment to FDC before treatment. In contrast, the expected time required for dissociation of an individual virion from FDC varies sensitively with the number of ligands attached to the virion that are available to interact with receptors on FDC. Although most virions may dissociate from FDC on the time scale of days to weeks, virions coupled to a higher-than-average number of ligands may persist on FDC for years. This result suggests that HAART may not be able to clear all HIV-1 trapped on FDC and that, even if clearance is possible, years of treatment will be required.
Figures


References
-
- Pantaleo G, Graziosi C, Demarest J F, Butini L, Montroni M, Fox C H, Orenstein J M, Kotler D P, Fauci A S. Nature (London) 1993;362:355–358. - PubMed
-
- Heath S L, Tew J G, Tew J G, Szakal A K, Burton G F. Nature (London) 1995;377:740–744. - PubMed
-
- Haase A T, Henry K, Zupancic M, Sedgewick G, Faust R A, Melroe H, Cavert W, Gebhard K, Staskus K, Zhang Z-Q, et al. Science. 1996;274:985–989. - PubMed
-
- Cavert W, Notermans D W, Staskus K, Wietgrefe S W, Zupancic M, Gebhard K, Henry K, Zhang Z-Q, Mills R, McDade H, et al. Science. 1997;276:960–964. - PubMed
Publication types
MeSH terms
Substances
Grants and funding
LinkOut - more resources
Full Text Sources
Medical
