

A molecular basis for nitric oxide sensing by soluble guanylate cyclase
- PMID: 10611285
- PMCID: PMC24720
- DOI: 10.1073/pnas.96.26.14753
A molecular basis for nitric oxide sensing by soluble guanylate cyclase
Abstract
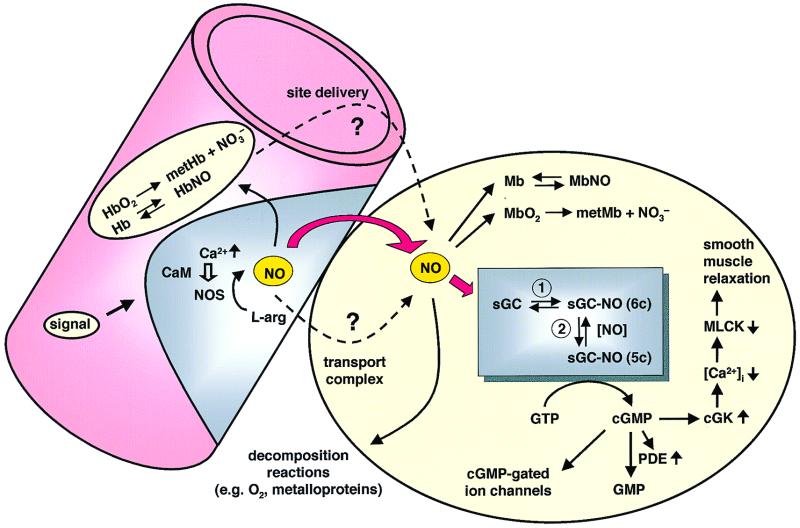
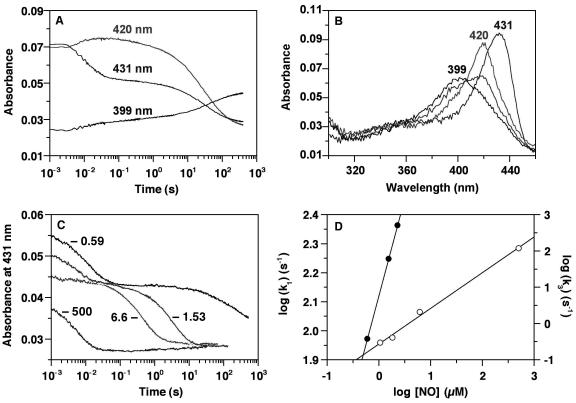
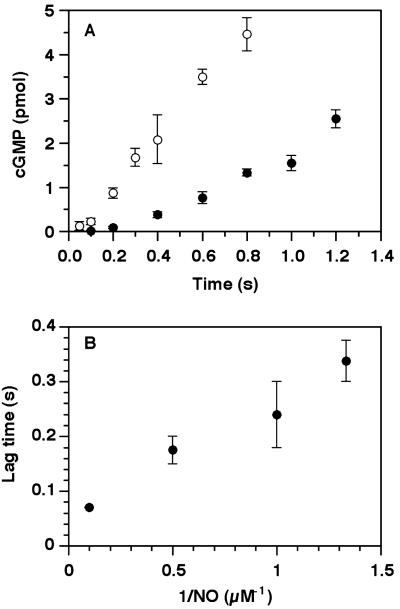
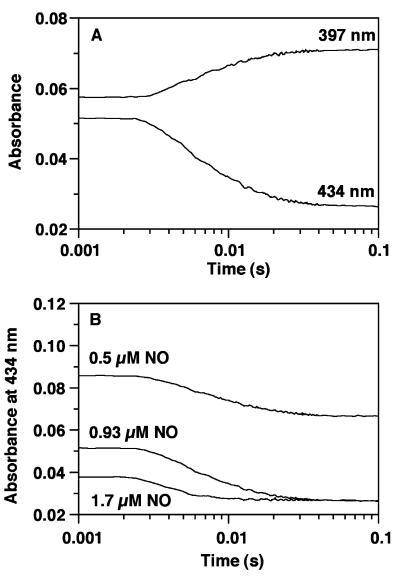
Nitric oxide (NO) functions as a signaling agent by activation of the soluble isoform of guanylate cyclase (sGC), a heterodimeric hemoprotein. NO binds to the heme of sGC and triggers formation of cGMP from GTP. Here we report direct kinetic measurements of the multistep binding of NO to sGC and correlate these presteady state events with activation of enzyme catalysis. NO binds to sGC to form a six-coordinate, nonactivated, intermediate (k(on) > 1.4 x 10(8) M(-1).s(-1) at 4 degrees C). Subsequent release of the axial histidine heme ligand is shown to be the molecular step responsible for activation of the enzyme. The rate at which this step proceeds also depends on NO concentration (k = 2.4 x 10(5) M(-1).s(-1) at 4 degrees C), thus identifying a novel mode of regulation by NO. NO binding to the isolated heme domain of sGC was also rapid (k = 7.1 +/- 2 x 10(8) M(-1).s(-1) at 4 degrees C); however, no intermediate was observed. The data show that sGC acts as an extremely fast, specific, and highly efficient trap for NO and that cleavage of the iron-histidine bond provides the driving force for activation of sGC. In addition, the kinetic data indicate that transport or stabilization of NO is not necessary for effective signal transmission.
Figures
Similar articles
-
Revisiting the kinetics of nitric oxide (NO) binding to soluble guanylate cyclase: the simple NO-binding model is incorrect.Proc Natl Acad Sci U S A. 2002 Sep 17;99(19):12097-101. doi: 10.1073/pnas.192209799. Epub 2002 Sep 3. Proc Natl Acad Sci U S A. 2002. PMID: 12209005 Free PMC article.
-
Regeneration of the ferrous heme of soluble guanylate cyclase from the nitric oxide complex: acceleration by thiols and oxyhemoglobin.Biochemistry. 1998 Dec 1;37(48):16898-907. doi: 10.1021/bi9814989. Biochemistry. 1998. PMID: 9836582
-
A novel insight into the heme and NO/CO binding mechanism of the alpha subunit of human soluble guanylate cyclase.J Biol Inorg Chem. 2011 Dec;16(8):1227-39. doi: 10.1007/s00775-011-0811-x. Epub 2011 Jul 2. J Biol Inorg Chem. 2011. PMID: 21725643
-
Soluble guanylate cyclase.Curr Opin Struct Biol. 2006 Dec;16(6):736-43. doi: 10.1016/j.sbi.2006.09.006. Epub 2006 Oct 2. Curr Opin Struct Biol. 2006. PMID: 17015012 Review.
-
Guanylate cyclase and the .NO/cGMP signaling pathway.Biochim Biophys Acta. 1999 May 5;1411(2-3):334-50. doi: 10.1016/s0005-2728(99)00024-9. Biochim Biophys Acta. 1999. PMID: 10320667 Review.
Cited by
-
How do heme-protein sensors exclude oxygen? Lessons learned from cytochrome c', Nostoc puntiforme heme nitric oxide/oxygen-binding domain, and soluble guanylyl cyclase.Antioxid Redox Signal. 2012 Nov 1;17(9):1246-63. doi: 10.1089/ars.2012.4564. Epub 2012 Apr 10. Antioxid Redox Signal. 2012. PMID: 22356101 Free PMC article. Review.
-
Comparative study of enzyme activity and heme reactivity in Drosophila melanogaster and Homo sapiens cystathionine β-synthases.Biochemistry. 2013 Jan 29;52(4):741-51. doi: 10.1021/bi300615c. Epub 2013 Jan 17. Biochemistry. 2013. PMID: 23002992 Free PMC article.
-
Molecular model of a soluble guanylyl cyclase fragment determined by small-angle X-ray scattering and chemical cross-linking.Biochemistry. 2013 Mar 5;52(9):1568-82. doi: 10.1021/bi301570m. Epub 2013 Feb 15. Biochemistry. 2013. PMID: 23363317 Free PMC article.
-
Quantitative vibrational dynamics of iron in nitrosyl porphyrins.J Am Chem Soc. 2004 Apr 7;126(13):4211-27. doi: 10.1021/ja038526h. J Am Chem Soc. 2004. PMID: 15053610 Free PMC article.
-
The receptor-like properties of nitric oxide-activated soluble guanylyl cyclase in intact cells.Mol Cell Biochem. 2002 Jan;230(1-2):165-76. Mol Cell Biochem. 2002. PMID: 11952092 Review.
References
-
- Marletta M A. Cell. 1994;78:927–930. - PubMed
-
- Ignarro L J. Biochem Pharmacol. 1991;41:485–490. - PubMed
-
- Denninger J W, Marletta M A. Biochim Biophys Acta. 1999;1411:334–350. - PubMed
-
- Zhao Y, Marletta M A. Biochemistry. 1997;36:15959–15964. - PubMed
-
- Zhao Y, Schevis J, Babcock G T, Marletta M A. Biochemistry. 1998;37:4502–4509. - PubMed
Publication types
MeSH terms
Substances
Grants and funding
LinkOut - more resources
Full Text Sources
Other Literature Sources
