. 1999 Dec 21;96(26):14931-6.
doi: 10.1073/pnas.96.26.14931.

The 65-kDa carrot microtubule-associated protein forms regularly arranged filamentous cross-bridges between microtubules

Affiliations

The 65-kDa carrot microtubule-associated protein forms regularly arranged filamentous cross-bridges between microtubules

J Chan et al. Proc Natl Acad Sci U S A. .

Abstract

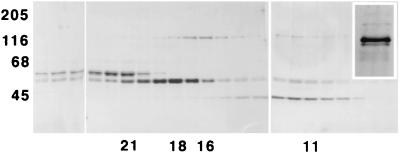
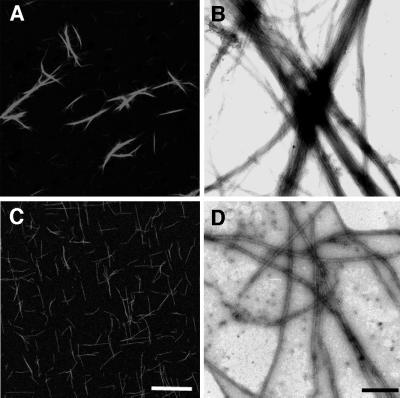
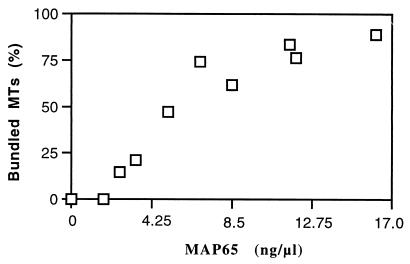
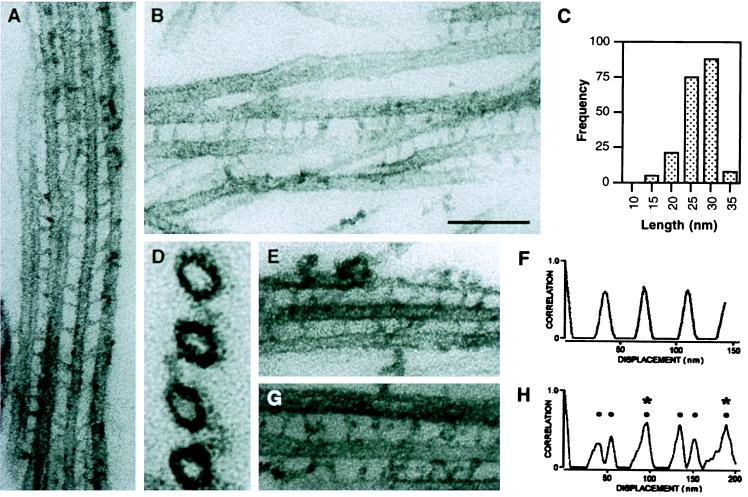
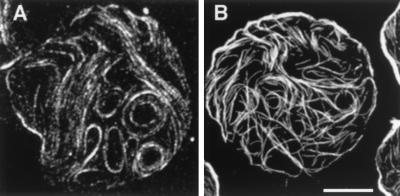
In plants, cortical microtubules (MTs) occur in characteristically parallel groups maintained up to one microtubule diameter apart by fine filamentous cross-bridges. However, none of the plant microtubule-associated proteins (MAPs) so far purified accounts for the observed separation between MTs in cells. We previously isolated from carrot cytoskeletons a MAP fraction including 120- and 65-kDa MAPs and have now separated the 65-kDa carrot MAP by sucrose density centrifugation. MAP65 does not induce tubulin polymerization but induces the formation of bundles of parallel MTs in a nucleotide-insensitive manner. The bundling effect is inhibited by porcine MAP2, but, unlike MAP2, MAP65 is heat-labile. In the electron microscope, MAP65 appears as filamentous cross-bridges, maintaining an intermicrotubule spacing of 25-30 nm. Microdensitometer-computer correlation analysis reveals that the cross-bridges are regularly spaced, showing a regular axial spacing that is compatible with a symmetrical helical superlattice for 13 protofilament MTs. Because MAP65 maintains in vitro the inter-MT spacing observed in plants and is shown to decorate cortical MTs, it is proposed that this MAP is important for the organization of the cortical array in vivo.


Figures

Figure 1
Figure 1
Purification of MAP65. The carrot MAP fraction was purified by sucrose density centrifugation. The silver-stained gel of the fractions (–5) shows separation of MAP65 from MAP120. Vertical axis, molecular weight markers; horizontal axis, key fractions. (Inset) Pooled MAP65 fraction showing the predominant 62-kDa member of the MAP65 triplet; MAP68 is shown as the thin band above.
Figure 2
Figure 2
MAP65 bundles microtubules. (A) Rhodamine-conjugated, taxol-stabilized MTs bundled by MAP65. (B) Negatively stained EM sample showing parallel, bundled MTs. (C and D) Control MTs without MAP65. [Bar = 36 μm (fluorescent images) and 500 nm (EM).]
Figure 3
Figure 3
Concentration effects of MAP65 on MT bundling. Increasing concentrations of MAP65 from 0 to 2 μM stimulate increased MT bundling (measured as percentage of single MTs relative to the MAP-free MT control).
Figure 4
Figure 4
(A and B) MTs bundled by MAP65. Inter-MT bridges appear as filaments projecting between walls of the MTs cut in longitudinal section. (C) Frequency histogram of the lengths of inter-MT bridges, which peak at 25–30 nm (n = 197). (D) MTs cut in transverse section, with filamentous bridges joining them. (E) The area between the upper two MTs was scanned to produce the autocorrelogram in F; a single axial repeat of 35.7 nm is evident. (G) The area between the upper two MTs was scanned to produce the autocorrelogram shown in H; peaks correspond to the spacings predicted by the 12-dimer superlattice model, which are indicated by dots. The lattice repeat distance is represented by strong peaks at 96 and 192 nm (asterisks). [Bar = 130 nm (A, B, D, E and G).]
Figure 5
Figure 5
Cortical MTs exposed on substrate-attached disks of plasma membrane from carrot protoplasts. Anti-MAP65 antibodies immunofluorescently stain the MTs in a punctate fashion (A), in contrast to the continuous pattern obtained with anti-tubulin (B). (Bar = 16 μm.)

References

    1. Hardham A R, Gunning B E S. J Cell Biol. 1978;77:14–34. - PMC - PubMed
    1. Seagull R W, Heath I B. Protoplasma. 1980;103:205–229.
    1. Akashi T, Shibaoka H. Plant Cell Physiol. 1987;28:339–348.
    1. Duckett C M, Lloyd C W. Plant J. 1994;5:363–372.
    1. Lloyd C W. Mol Biol Cell. 1994;5:1277–1280. - PMC - PubMed

Publication types

MeSH terms

LinkOut - more resources