. 1999 Dec 21;96(26):15103-8.
doi: 10.1073/pnas.96.26.15103.

A bcr-3 isoform of RARalpha-PML potentiates the development of PML-RARalpha-driven acute promyelocytic leukemia

Affiliations

A bcr-3 isoform of RARalpha-PML potentiates the development of PML-RARalpha-driven acute promyelocytic leukemia

J L Pollock et al. Proc Natl Acad Sci U S A. .

Abstract

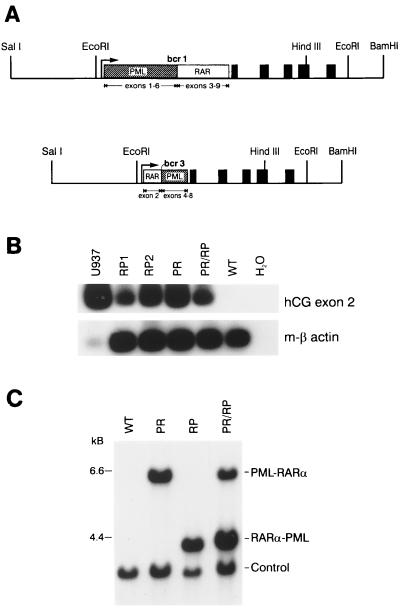
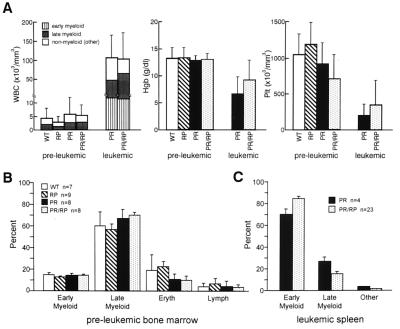
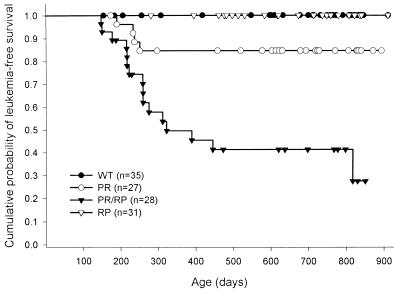
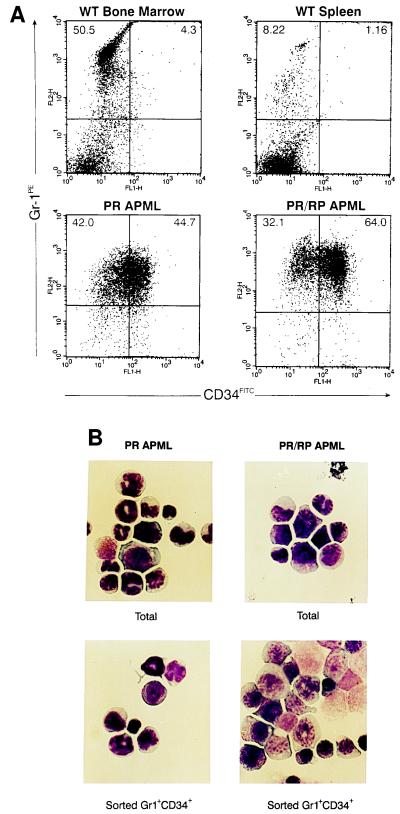
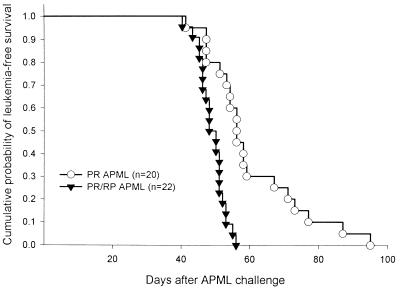
Acute promyelocytic leukemia (APML) most often is associated with the balanced reciprocal translocation t(15;17) (q22;q11.2) and the expression of both the PML-RARalpha and RARalpha-PML fusion cDNAs that are formed by this translocation. In this report, we investigated the biological role of a bcr-3 isoform of RARalpha-PML for the development of APML in a transgenic mouse model. Expression of RARalpha-PML alone in the early myeloid cells of transgenic mice did not alter myeloid development or cause APML, but its expression significantly increased the penetrance of APML in mice expressing a bcr-1 isoform of PML-RARalpha (15% of animals developed APML with PML-RARalpha alone vs. 57% with both transgenes, P < 0.001). The latency of APML development was not altered substantially by the expression of RARalpha-PML, suggesting that it does not behave as a classical "second hit" for development of the disease. Leukemias that arose from doubly transgenic mice were less mature than those from PML-RARalpha transgenic mice, but they both responded to all-trans retinoic acid in vitro. These findings suggest that PML-RARalpha drives the development of APML and defines its basic phenotype, whereas RARalpha-PML potentiates this phenotype via mechanisms that are not yet understood.


Figures

Figure 1
Figure 1
Construction, expression, and detection of hCG-PML-RARα and hCG RARα-PML transgenes. (A) Diagram of the transgenes. PR and RP cDNAs were ligated into the hCG gene at a synthetic polylinker near the hCG promoter as described previously (2). The 2.5-kb SalI-EcoRI fragment of the transgene contains the 5′ flanking region of the hCG gene. The PML-RARα and RARα-PML cDNAs are shown as boxes and are inserted into the 5′ untranslated region of the hCG gene. The solid boxes represent the five coding exons of hCG. The transgenes also contain the native 3′ flanking sequence of the gene to the BamHI site. (B) RT-PCR analysis of bone marrow RNA derived from PR and RP founder lines and from U937 cells [a human promonocytic cell line that expresses hCG, as a positive control (2)]. Primers spanning hCG exons 1–2 and 3–2 junctions were used to amplify hCG mRNA, as described previously (2). Primers specific for mouse β-actin were used to control for cDNA quality in each sample. The low signal generated in the U937 β-actin lane reflects the specificity of these primers for mouse β-actin. (C) Southern blot detection of transgenes. Tail DNAs were digested with EcoRI and analyzed by Southern blotting. Transgenes were identified with a radiolabeled probe derived from exon 2 of hCG. Doubly transgenic animals contained the expected 6- and 4-kb fragments corresponding to the PR and RP transgenes, respectively. The “control” band is generated by the hybridization of a probe specific for the murine granzyme A gene and serves as a control for DNA loading, transfer, and hybridization.
Figure 2
Figure 2
Hematologic analysis of young transgenic animals. (A) Comparison of peripheral blood counts. Blood was obtained from six cohorts of healthy age-matched, genotyped littermates at 2–9 months of age. Values represent the mean ± SD of total WBC (expressed as cells/mm3), hemoglobin (Hgb, expressed as gm/dl), and platelets (Plt, expressed as Plt × 103/mm3). PR and PR/RP leukemic animals (n = 4 for each) were also analyzed. (B) Comparison of bone marrow differentials from healthy young animals. Differential counts of at least 150 cells were performed by two independent observers blinded to genotypes. Values reflect the mean ± SD, indicated by error bars. Early myeloid cells include blasts, promyelocytes, and myelocytes, and late myeloid cells include metamyelocytes, band, and neutrophils. “Eryth” includes all erythroid precursors. (C) Comparison of differential counts from the leukemic spleens of PR vs. PR/RP transgenic mice. More than 95% of the cells in all spleens were myeloid. Early myeloid cells and late myeloid cells were defined as described above. The percentage of early myeloid cells is significantly higher (P < 0.05) in the PR/RP-derived spleens.
Figure 3
Figure 3
Kaplan–Meier analysis of APML disease in transgenic animals. One PR founder (135) was bred with two independently derived RP founders (2544 and 2683) to establish intercross cohorts. Animals were scored for development of APML (using criteria described previously; see ref. 3) when sacrificed or autopsied. Data represent the complete study of the first intercross (PR 135 × RP1 2544). The cumulative probability of death resulting from APML at 24 months is significantly higher in the PR/RP animals compared with the PR animals (P = 0.0005).
Figure 4
Figure 4
Flow cytometric analysis of APML cells. (A) Flow cytometric plots of WT bone marrow and spleen cells compared with PR and PR/RP APML spleen cells. All cells were stained for myeloid surface antigen Gr-1 (Gr-1PE) and the early hematopoietic progenitor marker CD34 (CD34FITC). The indicated gates were used to determine the percentage of cells positive for Gr-1 vs. Gr-1+/CD34+. (B) APML spleen cells were analyzed by Wright–Geimsa staining before and after flow cytometric sorting. Note that Gr-1+/CD34+ populations are enriched for early myeloid cells.
Figure 5
Figure 5
PR/RP leukemic spleen cells cause death in syngeneic recipients more quickly than PR cells. Each of three independent PR and PR/RP APML tumors were transferred into 20–22 C3H×BL/6 F1 recipients at 1–3 × 10⁶ cells per mouse. Animals were scored for APML on the day of sacrifice or at autopsy, and outcomes were plotted by using a Kaplan–Meier analysis. The difference between the time of death caused by PR vs. PR/RP leukemic spleen cells was highly significant (P < 0.001).

Similar articles

Cited by

References

    1. Lo Coco F, Diverio D, Falini B, Biondi A, Nervi C, Pelicci P G. Blood. 1999;94:12–22. - PubMed
    1. Melnick A, Licht J D. Blood. 1999;93:3167–3215. - PubMed
    1. Grisolano J L, Wesselschmidt R L, Pelicci P G, Ley T J. Blood. 1997;89:376–387. - PubMed
    1. Brown D, Kogan S, Lagasse E, Weissman I, Alcalay M, Pelicci P G, Atwater S, Bishop J M. Proc Natl Acad Sci USA. 1997;94:2551–2556. - PMC - PubMed
    1. He L-Z, Tribioli C, Rivi R, Peruzzi D, Pelicci P G, Soares V, Cattoretti G, Pandolfi P P. Proc Natl Acad Sci USA. 1997;94:5302–5307. - PMC - PubMed

Publication types

MeSH terms

LinkOut - more resources