

HIV-1 and T cell dynamics after interruption of highly active antiretroviral therapy (HAART) in patients with a history of sustained viral suppression
- PMID: 10611346
- PMCID: PMC24781
- DOI: 10.1073/pnas.96.26.15109
HIV-1 and T cell dynamics after interruption of highly active antiretroviral therapy (HAART) in patients with a history of sustained viral suppression
Abstract
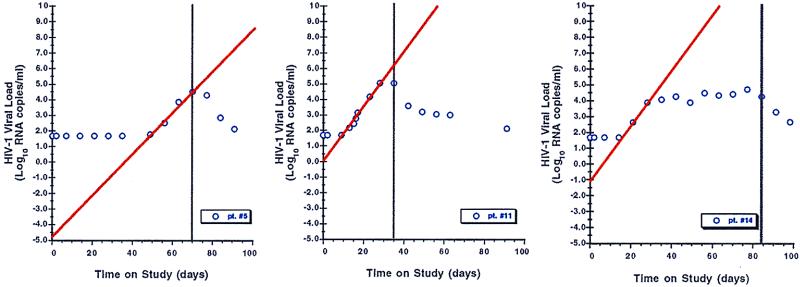
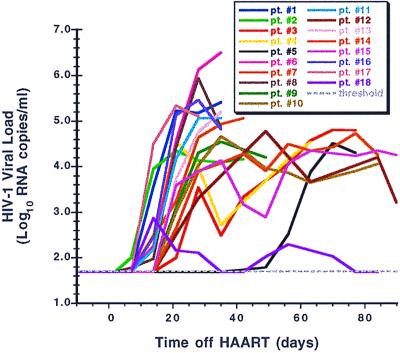
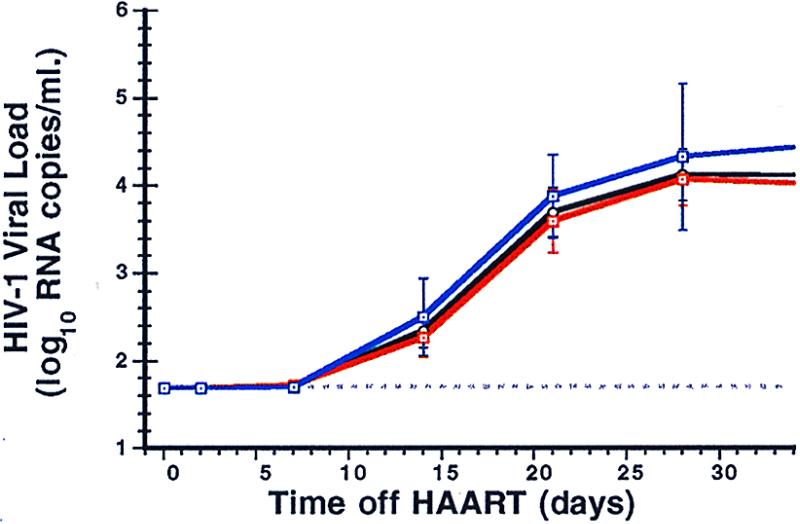
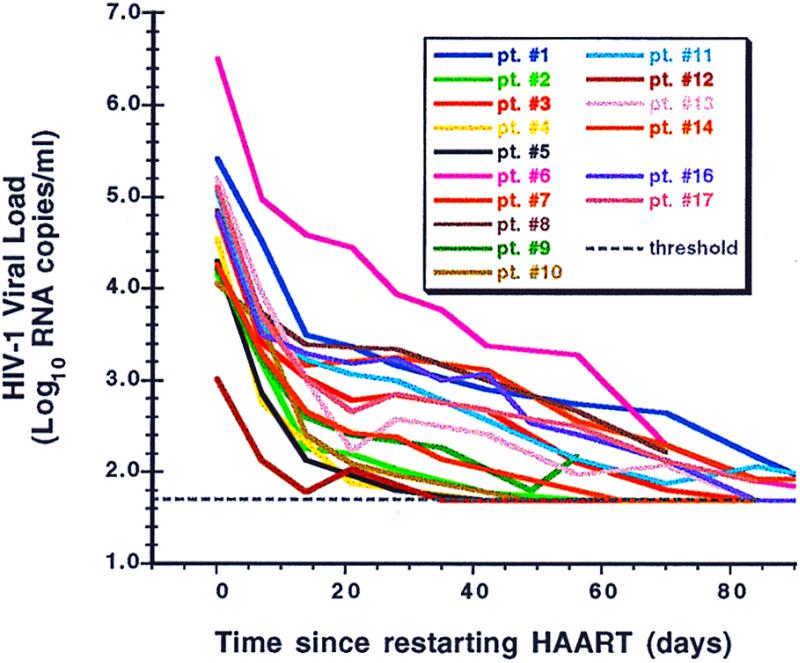
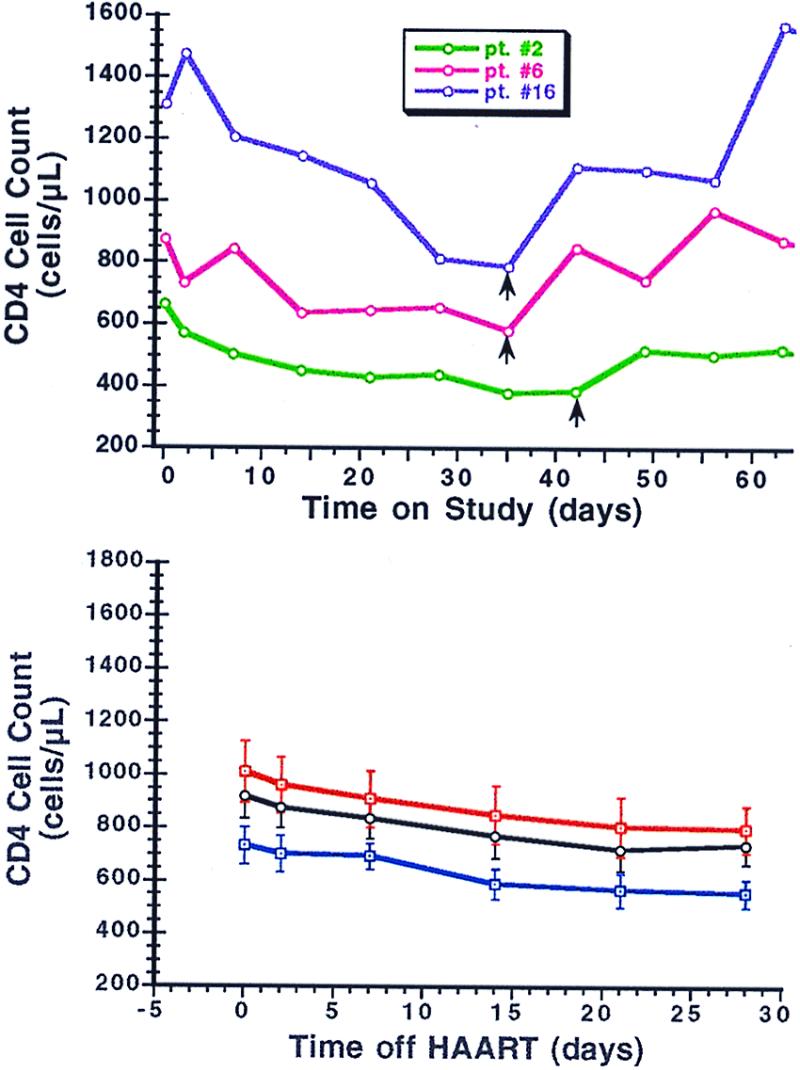
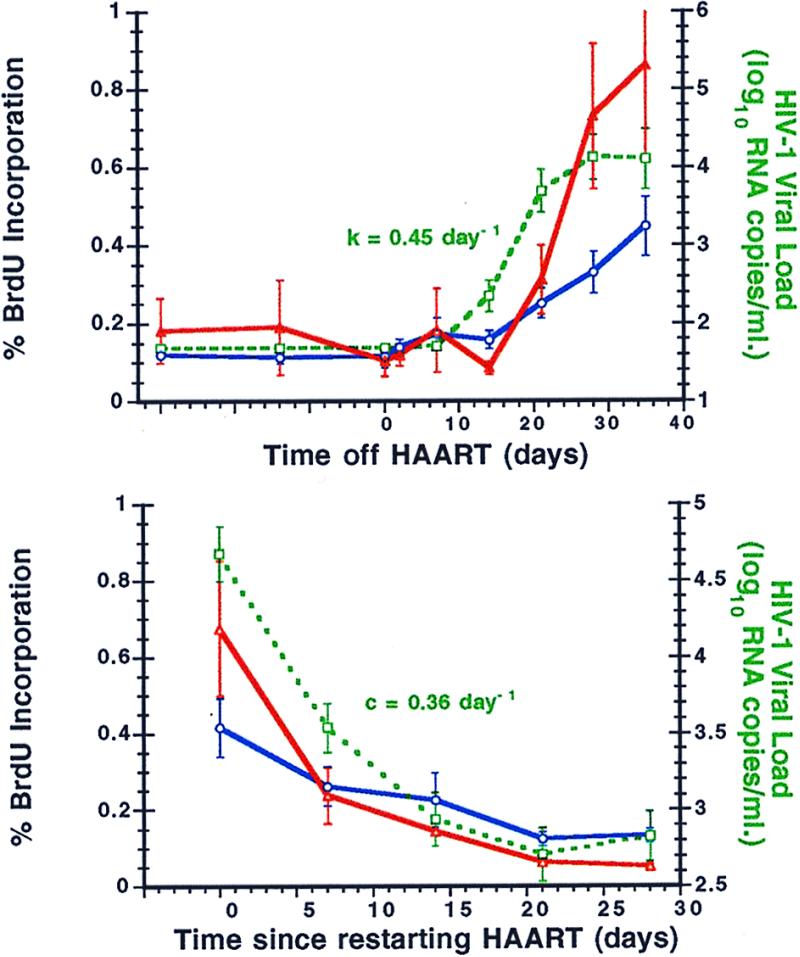
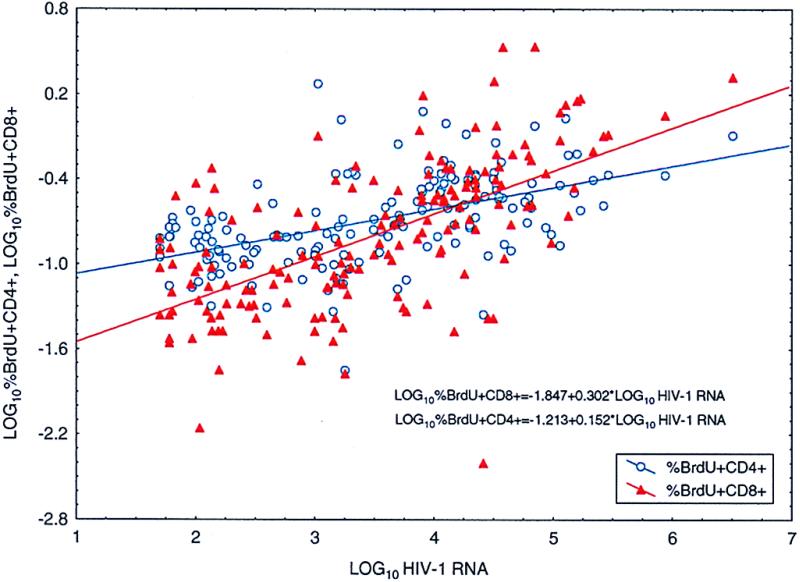
Identifying the immunologic and virologic consequences of discontinuing antiretroviral therapy in HIV-infected patients is of major importance in developing long-term treatment strategies for patients with HIV-1 infection. We designed a trial to characterize these parameters after interruption of highly active antiretroviral therapy (HAART) in patients who had maintained prolonged viral suppression on antiretroviral drugs. Eighteen patients with CD4(+) T cell counts >/= 350 cells/microliter and viral load below the limits of detection for >/=1 year while on HAART were enrolled prospectively in a trial in which HAART was discontinued. Twelve of these patients had received prior IL-2 therapy and had low frequencies of resting, latently infected CD4 cells. Viral load relapse to >50 copies/ml occurred in all 18 patients independent of prior IL-2 treatment, beginning most commonly during weeks 2-3 after cessation of HAART. The mean relapse rate constant was 0.45 (0.20 log(10) copies) day(-1), which was very similar to the mean viral clearance rate constant after drug resumption of 0.35 (0.15 log(10) copies) day(-1) (P = 0.28). One patient experienced a relapse delay to week 7. All patients except one experienced a relapse burden to >5,000 RNA copies/ml. Ex vivo labeling with BrdUrd showed that CD4 and CD8 cell turnover increased after withdrawal of HAART and correlated with viral load whereas lymphocyte turnover decreased after reinitiation of drug treatment. Virologic relapse occurs rapidly in patients who discontinue suppressive drug therapy, even in patients with a markedly diminished pool of resting, latently infected CD4(+) T cells.
Figures
References
-
- Chiasson M A, Berenson L, Li W H, Schwartz S, Singh T, Forlenza S, Mojica B A, Hamburg M A. J Acquired Immune Defic Syndr Hum Retrovirol. 1999;21:59–64. - PubMed
-
- Powderly W G, Landay A, Lederman M M. J Am Med Assoc. 1998;280:72–77. - PubMed
-
- Carr A, Samaras K, Burton S, Law M, Freund J, Chisholm D J, Cooper D A. AIDS. 1998;12:F51–F58. - PubMed
-
- Miller K D, Jones E, Yanovski J A, Shankar R, Feuerstein I, Falloon J. Lancet. 1998;351:871–875. - PubMed
-
- Carr A, Samaras K, Chisholm D J, Cooper D A. Lancet. 1998;351:1881–1883. - PubMed
Publication types
MeSH terms
Substances
LinkOut - more resources
Full Text Sources
Other Literature Sources
Medical
Research Materials
