Serial microanalysis of renal transcriptomes
- PMID: 10611377
- PMCID: PMC24812
- DOI: 10.1073/pnas.96.26.15286
Serial microanalysis of renal transcriptomes
Abstract
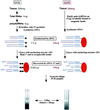
Large-scale gene expression studies can now be routinely performed on macroamounts of cells, but it is unclear to which extent current methods are valuable for analyzing complex tissues. In the present study, we used the method of serial analysis of gene expression (SAGE) for quantitative mRNA profiling in the mouse kidney. We first performed SAGE at the whole-kidney level by sequencing 12,000 mRNA tags. Most abundant tags corresponded to transcripts widely distributed or enriched in the predominant kidney epithelial cells (proximal tubular cells), whereas transcripts specific for minor cell types were barely evidenced. To better explore such cells, we set up a SAGE adaptation for downsized extracts, enabling a 1, 000-fold reduction of the amount of starting material. The potential of this approach was evaluated by studying gene expression in microdissected kidney tubules (50,000 cells). Specific gene expression profiles were obtained, and known markers (e.g., uromodulin in the thick ascending limb of Henle's loop and aquaporin-2 in the collecting duct) were found appropriately enriched. In addition, several enriched tags had no databank match, suggesting that they correspond to unknown or poorly characterized transcripts with specific tissue distribution. It is concluded that SAGE adaptation for downsized extracts makes possible large-scale quantitative gene expression measurements in small biological samples and will help to study the tissue expression and function of genes not evidenced with other high-throughput methods.
Figures


References
-
- Schena M, Shalon D, Davis R W, Brown P O. Science. 1995;270:467–470. - PubMed
-
- Velculescu V E, Zhang L, Vogelstein B, Kinzler K W. Science. 1995;270:484–487. - PubMed
-
- Velculescu V E, Zhang L, Zhou W, Vogelstein J, Basrai M A, Bassett D E, Jr, Hieter P, Vogelstein B, Kinzler K W. Cell. 1997;88:243–251. - PubMed
-
- DeRisi J L, Iyer V R, Brown P O. Science. 1997;278:680–686. - PubMed
-
- Wodicka L, Dong H, Mittmann M, Ho M-H, Lockhart D J. Nat Biotech. 1997;15:1359–1367. - PubMed
MeSH terms
LinkOut - more resources
Full Text Sources
Other Literature Sources

