. 1999 Dec 27;147(7):1493-502.
doi: 10.1083/jcb.147.7.1493.

Adenine nucleotide translocase-1, a component of the permeability transition pore, can dominantly induce apoptosis

Affiliations

Adenine nucleotide translocase-1, a component of the permeability transition pore, can dominantly induce apoptosis

M K Bauer et al. J Cell Biol. .

Abstract

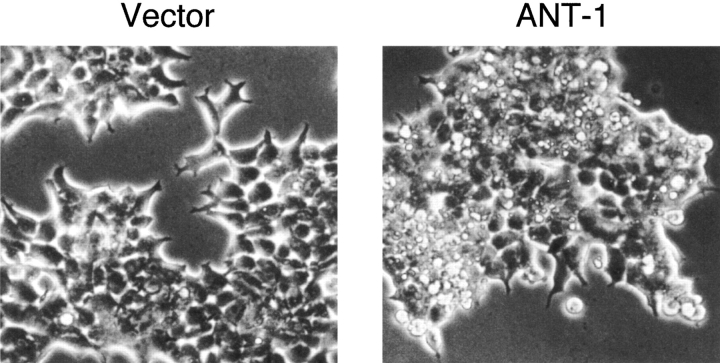
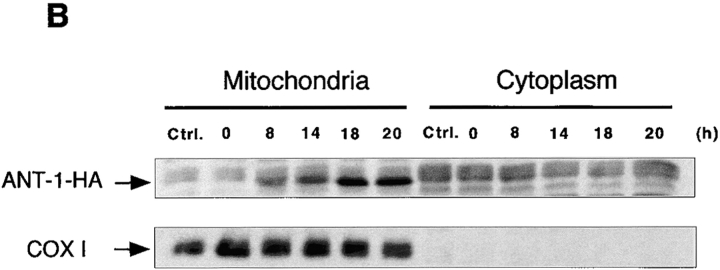
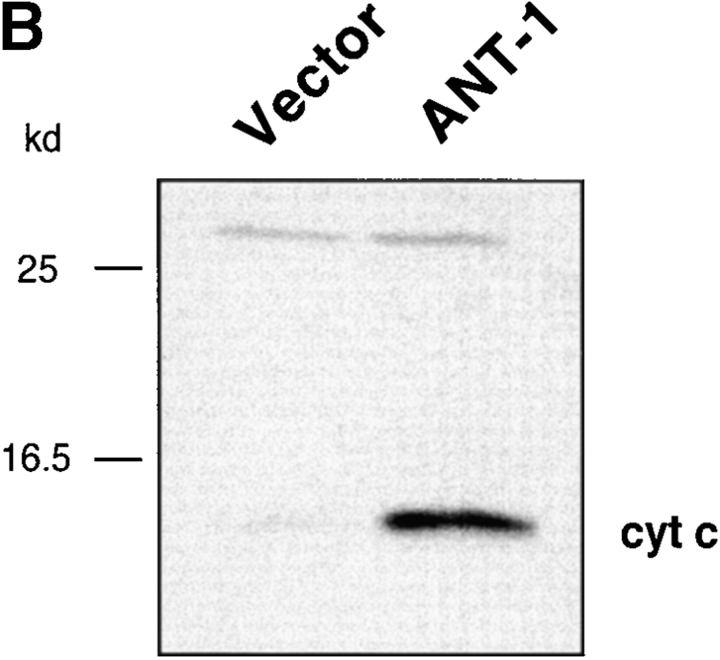
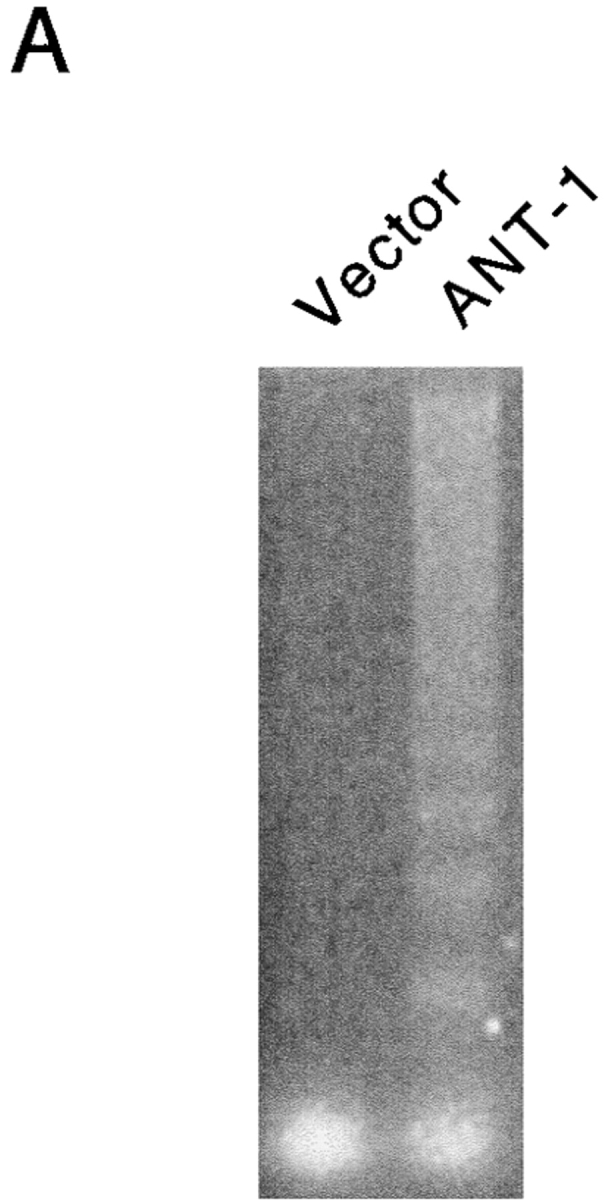
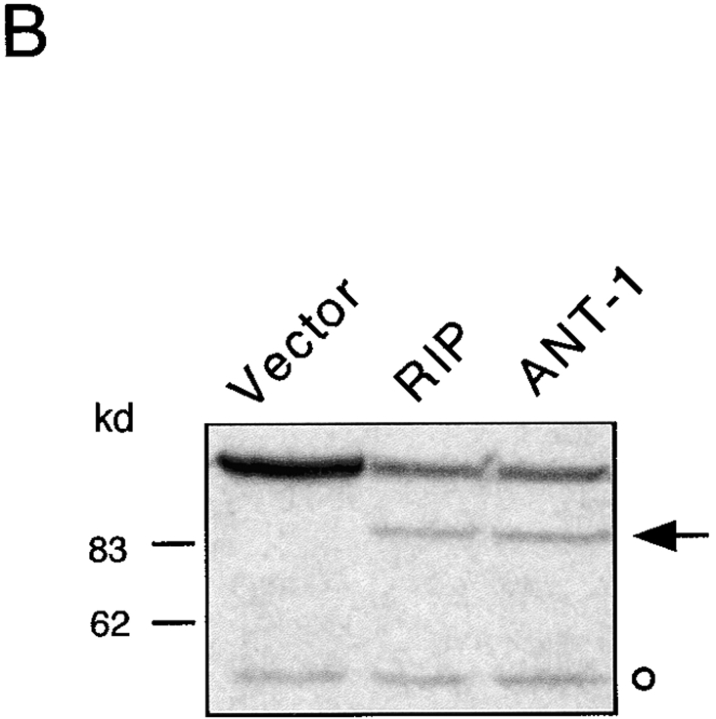
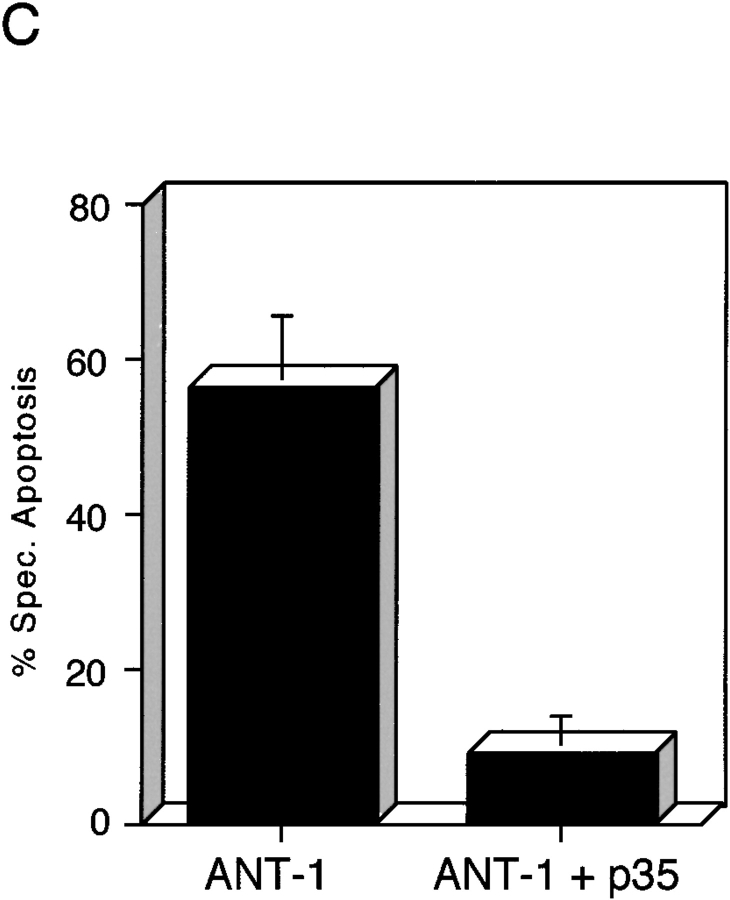
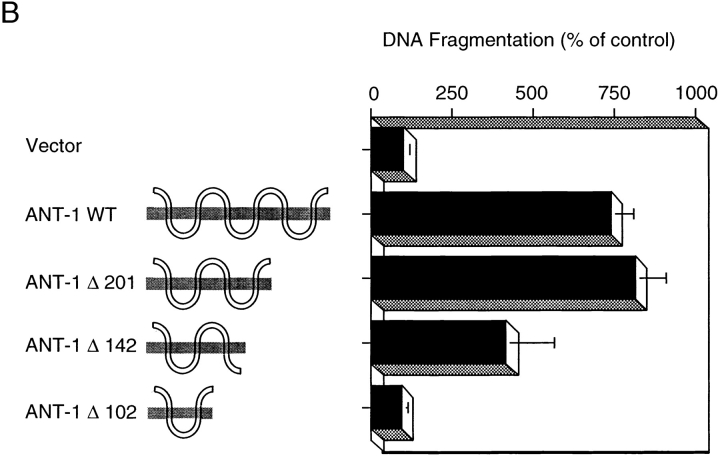
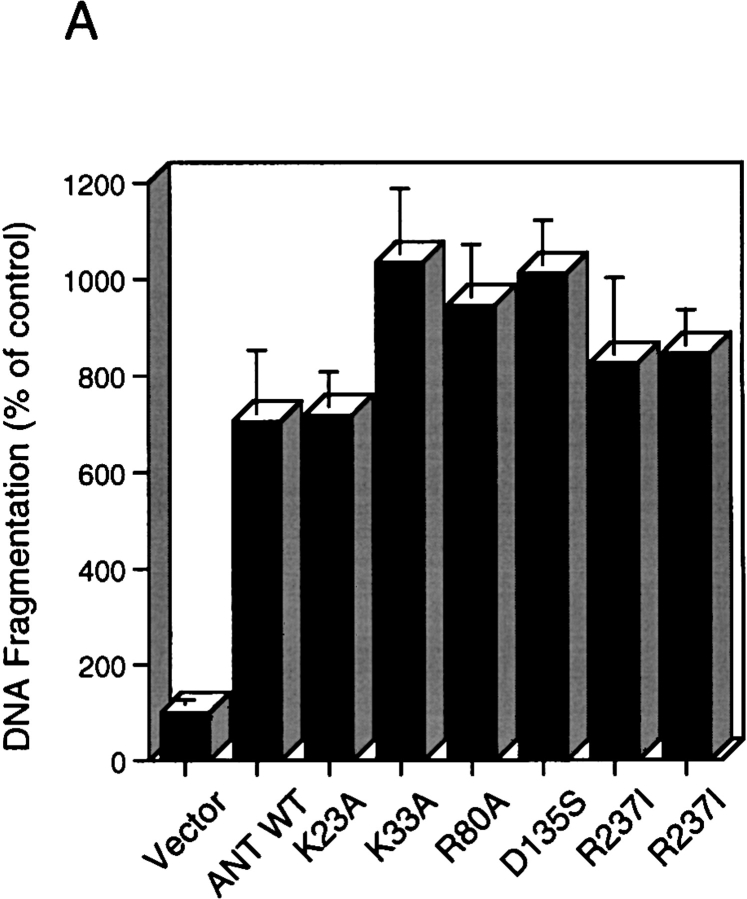
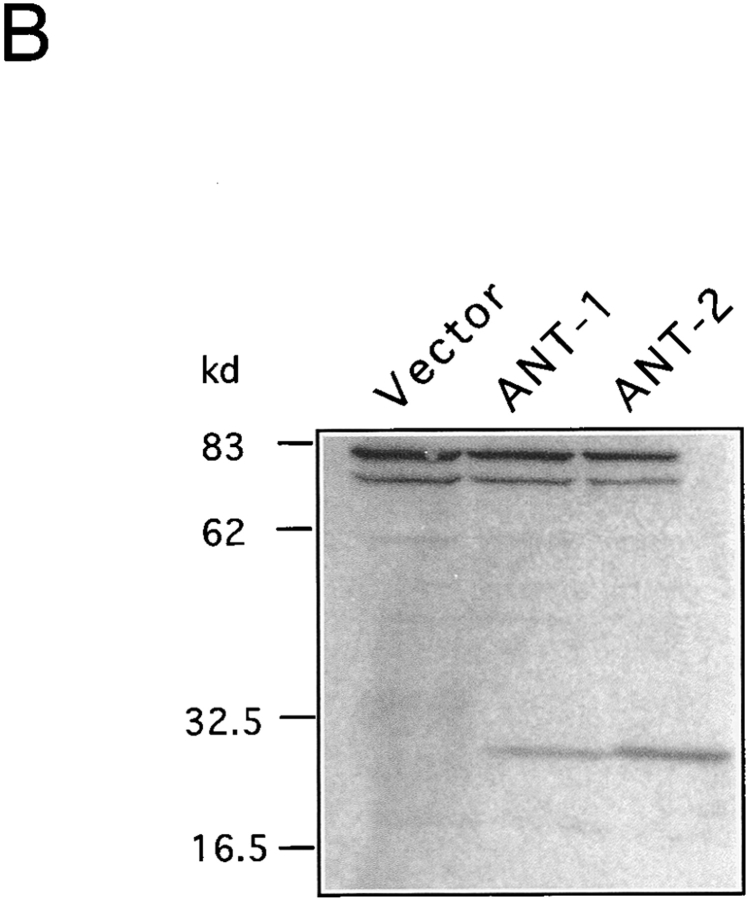
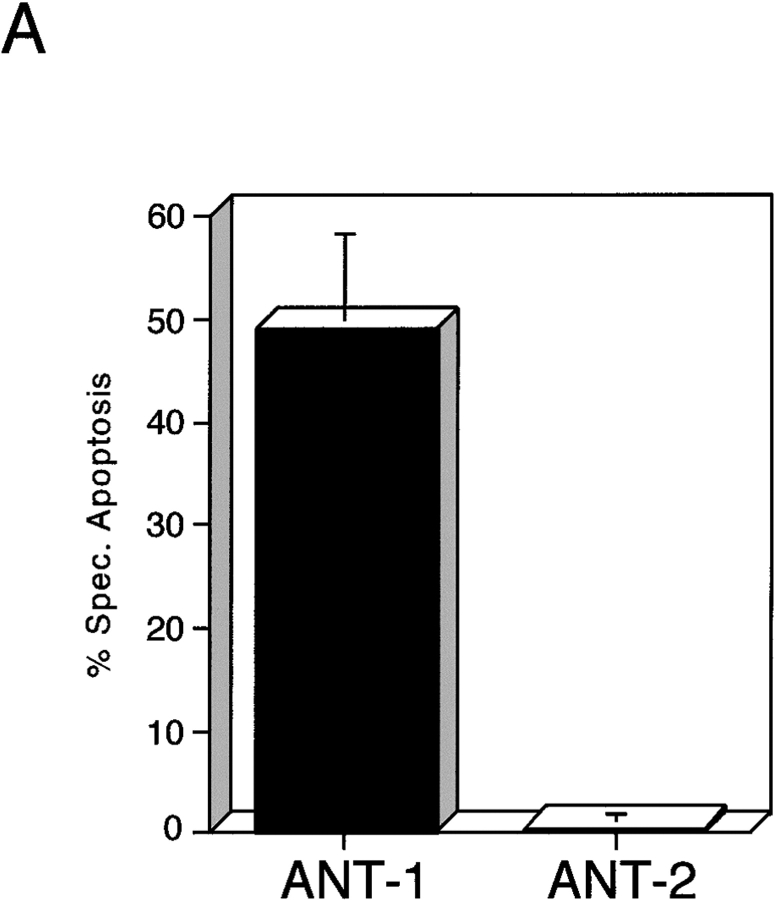
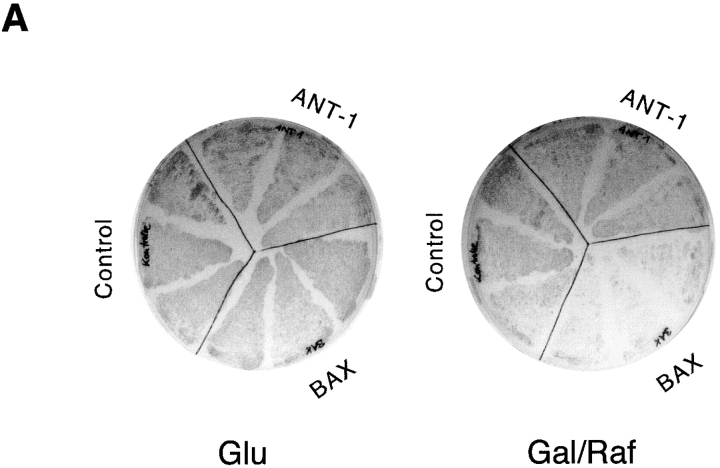
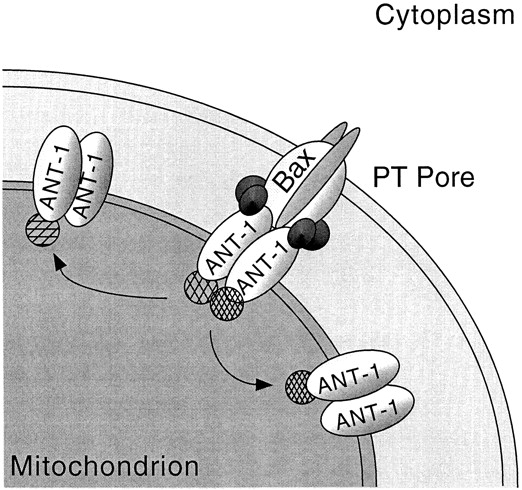
Here, we describe the isolation of adenine nucleotide translocase-1 (ANT-1) in a screen for dominant, apoptosis-inducing genes. ANT-1 is a component of the mitochondrial permeability transition complex, a protein aggregate connecting the inner with the outer mitochondrial membrane that has recently been implicated in apoptosis. ANT-1 expression led to all features of apoptosis, such as phenotypic alterations, collapse of the mitochondrial membrane potential, cytochrome c release, caspase activation, and DNA degradation. Both point mutations that impair ANT-1 in its known activity to transport ADP and ATP as well as the NH(2)-terminal half of the protein could still induce apoptosis. Interestingly, ANT-2, a highly homologous protein could not lead to cell death, demonstrating the specificity of the signal for apoptosis induction. In contrast to Bax, a proapoptotic Bcl-2 gene, ANT-1 was unable to elicit a form of cell death in yeast. This and the observed repression of apoptosis by the ANT-1-interacting protein cyclophilin D suggest that the suicidal effect of ANT-1 is mediated by specific protein-protein interactions within the permeability transition pore.


Figures

Figure 1
Figure 1
ANT-1 expression leads to phenotypic apoptosis induction. The empty vector or an expression plasmid for ANT-1 were transiently transfected into 293T cells. After 16 h, phase-contrast pictures were taken at a 200-fold magnification.
Figure 2
Figure 2
Time course of apoptosis induction and protein expression after ANT-1 transfection. (A) Temporal increase of apoptosis induced by ANT-1 expression. 1 μg of the HA-tagged ANT-1 plasmid was transfected into 293T cells for each condition. Quantitative FACS analysis of sub-G1–positive cells was performed at the indicated time points. The specific apoptosis induction above background is shown as a percentage of apoptotic cells relative to all transfected cells. The means and the SDs are given for each experiment. (B) Transfected ANT-1 progressively accumulates in mitochondria. Cytoplasmic and mitochondrial cell fractions were prepared from aliquots taken from the samples under A. 35 μg of each were subjected to SDS-PAGE and subsequent immunoblot analysis using an anti–HA tag antibody to specifically detect the transfected ANT-1. The membrane was stripped and reprobed with an mAb against subunit I of cytochrome c oxidase (COX I) to demonstrate the purity of the mitochondrial preparations.
Figure 2
Figure 2
Time course of apoptosis induction and protein expression after ANT-1 transfection. (A) Temporal increase of apoptosis induced by ANT-1 expression. 1 μg of the HA-tagged ANT-1 plasmid was transfected into 293T cells for each condition. Quantitative FACS analysis of sub-G1–positive cells was performed at the indicated time points. The specific apoptosis induction above background is shown as a percentage of apoptotic cells relative to all transfected cells. The means and the SDs are given for each experiment. (B) Transfected ANT-1 progressively accumulates in mitochondria. Cytoplasmic and mitochondrial cell fractions were prepared from aliquots taken from the samples under A. 35 μg of each were subjected to SDS-PAGE and subsequent immunoblot analysis using an anti–HA tag antibody to specifically detect the transfected ANT-1. The membrane was stripped and reprobed with an mAb against subunit I of cytochrome c oxidase (COX I) to demonstrate the purity of the mitochondrial preparations.
Figure 3
Figure 3
Effect of ANT-1 expression on mitochondria. (A) ANT-1 overexpression leads to the collapse of the inner mitochondrial membrane potential. HeLa cells were transfected with an expression vector for GFP (2 μg) together with a control vector (Vector, 2 μg) or a plasmid for ANT-1 (ANT-1, 2 μg). After 16 h, the cells were treated with CMXRos, which stains mitochondria with an intact membrane potential. Subsequently, phase-contrast and fluorescence microscopy pictures for GFP and CMXRos activity were taken. (B) ANT-1 induces the release of cytochrome c from mitochondria. 293T cells were transfected with a control vector or an expression vector for ANT-1. Cytoplasmic extracts were prepared and assayed for the presence of cytochrome c (cyt c) by a Western blot. Molecular mass standards are given on the left. Equal loading of the gel is indicated by an upper unspecific band with equal intensity.
Figure 3
Figure 3
Effect of ANT-1 expression on mitochondria. (A) ANT-1 overexpression leads to the collapse of the inner mitochondrial membrane potential. HeLa cells were transfected with an expression vector for GFP (2 μg) together with a control vector (Vector, 2 μg) or a plasmid for ANT-1 (ANT-1, 2 μg). After 16 h, the cells were treated with CMXRos, which stains mitochondria with an intact membrane potential. Subsequently, phase-contrast and fluorescence microscopy pictures for GFP and CMXRos activity were taken. (B) ANT-1 induces the release of cytochrome c from mitochondria. 293T cells were transfected with a control vector or an expression vector for ANT-1. Cytoplasmic extracts were prepared and assayed for the presence of cytochrome c (cyt c) by a Western blot. Molecular mass standards are given on the left. Equal loading of the gel is indicated by an upper unspecific band with equal intensity.
Figure 4
Figure 4
Effect of ANT-1 on protein and DNA degradation. (A) ANT-1 induces internucleosomal DNA cleavage. 293T cells were transfected with an empty vector or with an expression construct for ANT-1. Low molecular mass DNA was isolated from transfected cells, separated on a 2% agarose gel, and stained with ethidium bromide. (B) ANT-1 leads to the degradation of PARP. 293T cells were transfected with an empty control vector, an expression vector for the death domain protein RIP or with ANT-1. 16 h later, nuclear extracts of the transfected cells were prepared and investigated for the status of PARP in a Western blot. The generated PARP fragment is indicated by an arrow. An unspecific signal (o) served as an internal control for equal loading of the gel. (C) Inhibition of ANT-1 apoptosis by a specific inhibitor for caspases. ANT-1 (1 μg) and a control vector (10 μg) or an expression vector (10 μg) for the caspase inhibitor p35 from baculovirus were cotransfected, and the specific apoptosis induction was determined by FACS analysis. The means and the SDs are indicated (n = 3).
Figure 4
Figure 4
Effect of ANT-1 on protein and DNA degradation. (A) ANT-1 induces internucleosomal DNA cleavage. 293T cells were transfected with an empty vector or with an expression construct for ANT-1. Low molecular mass DNA was isolated from transfected cells, separated on a 2% agarose gel, and stained with ethidium bromide. (B) ANT-1 leads to the degradation of PARP. 293T cells were transfected with an empty control vector, an expression vector for the death domain protein RIP or with ANT-1. 16 h later, nuclear extracts of the transfected cells were prepared and investigated for the status of PARP in a Western blot. The generated PARP fragment is indicated by an arrow. An unspecific signal (o) served as an internal control for equal loading of the gel. (C) Inhibition of ANT-1 apoptosis by a specific inhibitor for caspases. ANT-1 (1 μg) and a control vector (10 μg) or an expression vector (10 μg) for the caspase inhibitor p35 from baculovirus were cotransfected, and the specific apoptosis induction was determined by FACS analysis. The means and the SDs are indicated (n = 3).
Figure 5
Figure 5
Mutational analysis of ANT-1's apoptosis activity. (A) Cell death induction by point mutants of ANT-1. 1 μg of wild-type ANT-1 (ANT-1 WT) and six point mutants that have been shown to be deficient for ADP/ATP transport were transfected into 293T cells. The wild-type amino acid, its position, as well as the mutated residue are given for each mutant construct. After 16 h, apoptosis induction by the various constructs was measured by ELISA for internucleosomal DNA fragments. The DNA fragmentation as a percentage of control is given as an index for apoptosis induction. The means and the SDs are indicated (n = 3). (B) Apoptosis activity of ANT-1 deletion mutants. Wild-type ANT-1 (1 μg) or three COOH-terminal deletion mutants (1 μg) were transiently transfected into 293T cells. The last COOH-terminal residue of each deletion mutant is indicated. For the ANT-1 WT and each mutant, the structure of the generated protein is depicted schematically with the membrane indicated as a shaded area. After 16 h, the constructs were tested for apoptosis induction by a specific ELISA as described in A.
Figure 5
Figure 5
Mutational analysis of ANT-1's apoptosis activity. (A) Cell death induction by point mutants of ANT-1. 1 μg of wild-type ANT-1 (ANT-1 WT) and six point mutants that have been shown to be deficient for ADP/ATP transport were transfected into 293T cells. The wild-type amino acid, its position, as well as the mutated residue are given for each mutant construct. After 16 h, apoptosis induction by the various constructs was measured by ELISA for internucleosomal DNA fragments. The DNA fragmentation as a percentage of control is given as an index for apoptosis induction. The means and the SDs are indicated (n = 3). (B) Apoptosis activity of ANT-1 deletion mutants. Wild-type ANT-1 (1 μg) or three COOH-terminal deletion mutants (1 μg) were transiently transfected into 293T cells. The last COOH-terminal residue of each deletion mutant is indicated. For the ANT-1 WT and each mutant, the structure of the generated protein is depicted schematically with the membrane indicated as a shaded area. After 16 h, the constructs were tested for apoptosis induction by a specific ELISA as described in A.
Figure 6
Figure 6
Effect of ANT-1 and ANT-2 on transfected cells. (A) Comparison between the apoptotic capacities of ANT-1 and ANT-2. Expression plasmids for ANT-1 (1 μg) and ANT-2 (1 μg) were transfected in 293T cells. After 16 h, apoptosis induction in transfected cells was measured by FACS analysis of sub-G1–positive cells. The specific apoptosis induction above background is shown as a percentage of apoptotic cells relative to all transfected cells. The means and the SDs are indicated (n = 3). (B) Expression and localization of ANT-1 and ANT-2. 293T cells were transfected with a control vector or expression vectors for HA-tagged ANT-1 and ANT-2. Mitochondrial extracts of transfected cells were prepared and investigated for the presence of the proteins with an anti–HA antibody in a Western blot. Equal loading of the gel was verified by two unspecific upper bands.
Figure 6
Figure 6
Effect of ANT-1 and ANT-2 on transfected cells. (A) Comparison between the apoptotic capacities of ANT-1 and ANT-2. Expression plasmids for ANT-1 (1 μg) and ANT-2 (1 μg) were transfected in 293T cells. After 16 h, apoptosis induction in transfected cells was measured by FACS analysis of sub-G1–positive cells. The specific apoptosis induction above background is shown as a percentage of apoptotic cells relative to all transfected cells. The means and the SDs are indicated (n = 3). (B) Expression and localization of ANT-1 and ANT-2. 293T cells were transfected with a control vector or expression vectors for HA-tagged ANT-1 and ANT-2. Mitochondrial extracts of transfected cells were prepared and investigated for the presence of the proteins with an anti–HA antibody in a Western blot. Equal loading of the gel was verified by two unspecific upper bands.
Figure 7
Figure 7
Effect of Bax and ANT-1 expression on the growth of yeast cells. (A) Bax but not ANT-1 leads to growth inhibition in yeast. Bax and ANT-1 cloned in expression vectors under the control of a galactose and raffinose-inducible promoter and the empty control vector were introduced into yeast cells. 4.5 × 10⁴ yeast cells of three independent clones each were plated on glucose (glu)- or galactose and raffinose (gal/raf)–containing agar. The growth of the yeast cells was monitored 36 h later. (B) Control of inducible expression of ANT-1 and Bax in yeast cells. Yeast clones from A were kept in normal medium or incubated in galactose and raffinose–containing medium for 8 h. Extracts were prepared, and equal amounts (40 μg) of proteins were investigated for the expression of Bax and ANT-1 in a Western blot. The antiserum against ANT-1 does also recognize the endogenous yeast ANT-1.
Figure 7
Figure 7
Effect of Bax and ANT-1 expression on the growth of yeast cells. (A) Bax but not ANT-1 leads to growth inhibition in yeast. Bax and ANT-1 cloned in expression vectors under the control of a galactose and raffinose-inducible promoter and the empty control vector were introduced into yeast cells. 4.5 × 10⁴ yeast cells of three independent clones each were plated on glucose (glu)- or galactose and raffinose (gal/raf)–containing agar. The growth of the yeast cells was monitored 36 h later. (B) Control of inducible expression of ANT-1 and Bax in yeast cells. Yeast clones from A were kept in normal medium or incubated in galactose and raffinose–containing medium for 8 h. Extracts were prepared, and equal amounts (40 μg) of proteins were investigated for the expression of Bax and ANT-1 in a Western blot. The antiserum against ANT-1 does also recognize the endogenous yeast ANT-1.
Figure 8
Figure 8
Inhibition of ANT-1–induced apoptosis. (A) ANT-1–induced apoptosis can be repressed by bongkrekic acid, a specific inhibitor of the PT pore. An expression vector for ANT-1 (1 μg) was transfected into plates with 293T cells. One group of plates was left untreated, the other was supplied with 50 μM bongkrekic acid (BA) for 16 h after the transfection. Apoptosis was quantified as in Fig. 5. (B) ANT-1 apoptosis can be repressed by cyclophilin D, another component of the permeability transition pore. ANT-1 (1 μg) and an expression plasmid (10 μg) for cyclophilin D (Cyclo D) or a control vector (10 μg) were transfected into 293T cells, and apoptosis was determined as described in Fig. 6.
Figure 9
Figure 9
Hypothetical model for ANT-1's apoptosis-inducing activity. The PT pore complex is depicted with its different components in the outer and inner mitochondrial membrane. According to the model, ANT-1 can interact with proteins that repress the PT pore (indicated as hatched circles) and with proteins that facilitate apoptosis (indicated in dark shading). Overexpressed ANT-1 proteins (shown on the right and left) do not form an activated PT pore on their own, but rather titrate out the repressors of the endogenous PT pore that activate the PT pore. For this activation, additional proteins are needed that are not titrated out by hyperexpressed ANT-1 because they need additional interaction partners for their affinity to ANT-1. See text for a more detailed discussion of this model.

References

    1. Ausubel F.M., Brent R., Kingston R.E., Moore D.D., Seidman J.G., Smith A., Struhl K. Current Protocols in Molecular Biology. Wiley Interscience; New York: 1991.
    1. Bitzer M., Prinz F., Bauer M., Spiegel M., Neubert W.J., Gregor M., Schulze-Osthoff K., Lauer U. Sendai virus infection induces apoptosis through activation of caspase-8 (FLICE) and caspase-3 (CPP32) J. Virol. 1999;73:702–708. - PMC - PubMed
    1. Brustovetsky N., Klingenberg M. Mitochondrial ADP/ATP carrier can be reversibly converted into a large channel by Ca2+ . Biochemistry. 1996;35:8483–8488. - PubMed
    1. Clem R.J., Miller L.K. Control of programmed cell death by the baculovirus genes p35 and iap. Mol. Cell. Biol. 1994;14:5212–5222. - PMC - PubMed
    1. Davidson A.M., Halestrap A.P. Liver mitochondrial pyro-phosphate concentration is increased by Ca2+ and regulates the intramitochondrial volume and adenine nucleotide content. Biochem. J. 1987;246:715–723. - PMC - PubMed

Publication types

MeSH terms