. 2000 Jan 1;522 Pt 1(Pt 1):3-17.
doi: 10.1111/j.1469-7793.2000.t01-5-00003.xm.

Developmental change in GABAA receptor desensitization kinetics and its role in synapse function in rat cortical neurons

Affiliations

Developmental change in GABAA receptor desensitization kinetics and its role in synapse function in rat cortical neurons

B Hutcheon et al. J Physiol. .

Abstract

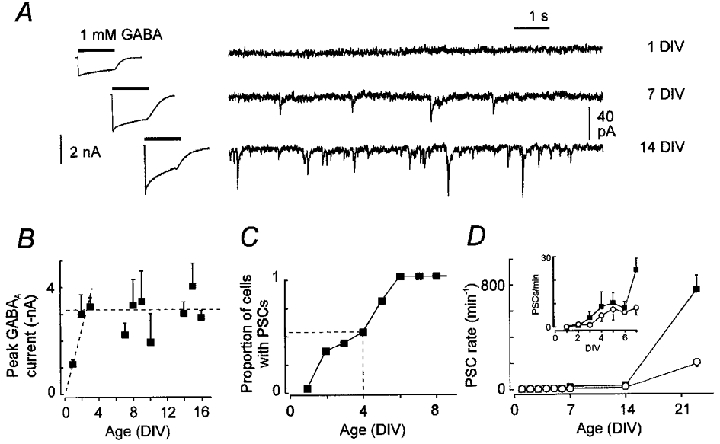
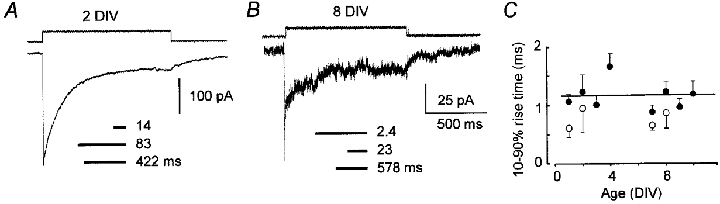
We examined the maturation of GABAA receptor synapses in cortical pyramidal neurons cultured from embryonic rats. The decay kinetics of GABAA receptor-mediated miniature postsynaptic currents (mPSCs) were compared with those of responses evoked by GABA in excised membrane patches. Fast perfusion of 1 or 10 mM GABA on membrane patches evoked currents with different desensitizing time courses in young and old neurons. For neurons older than 4 days in vitro (DIV), GABAA currents had a fast component of desensitization (median approximately 3 ms) seldom seen in patches from younger neurons. In contrast, mPSCs exhibited a substantial fast component of decay at 2-4 DIV that became more prominent with further development although the median value of its time constant remained unchanged. The selective alpha3 subunit positive modulator SB-205384 had no effect on mPSCs at any time in vitro but potentiated extrasynaptic activity. This suggests that synapse maturation does not proceed by a gradual exchange of early embryonic GABAA receptor subforms for adult forms. At all ages, the kinetic properties of mPSCs were heterogeneous. This heterogeneity extended to the level of mPSCs from single neurons and may be a normal aspect of synaptic functioning. These results suggest that inhibitory synapses in developing neurons are capable of selectively capturing GABAA receptors having fast desensitization kinetics. This functional preference probably reflects the developmental turning point from an inwardly looking trophic capacity of embryonic GABAA receptors to a role concerned with information processing.


Figures

Figure 1
Figure 1. Method for grouping time constant values
Demonstrated for a data set consisting of theoretical decay time constants for 10 different mPSCs. Each mPSC has two time constants with the faster of the pair indicated by a small filled rectangle and the slower by a large filled rectangle. A single boundary is sought that optimally separates the fast and slow components over the entire data set. Although any choice of boundary results in misclassified time constants, the dashed line indicates the optimal boundary, as explained in the text. This boundary placement has resulted in the fastest time constant for one mPSC (circled) being misclassified as a slow time constant.
Figure 2
Figure 2. Neocortical neurons in culture have normal developmental attributes
A, development of somatic capacitance (○) and leak-subtracted peak inward currents evoked by +50 mV voltage steps from a holding potential of −80 mV (•). Both measures exhibit large increases during the first week of culture and relative stability thereafter. Data represented as means and s.e.m.B, fura-2 ratiometric fluorimetry reveals that 1 mM GABA (arrows) increases [Ca2+]i in 3 DIV neurons (Ba) but not in 24 DIV neurons (Bb). Elevation of external K+ concentration (arrowhead) following GABA administration to 24 DIV neurons demonstrates that [Ca2+]i levels are still affected by depolarization. Note that GABA disrupts ongoing [Ca2+]i oscillations in the older neurons. C, histogram of relative levels of mRNA for various GABAAα subunits in cultures after 3 and 17 DIV. Asterisks denote significant differences between ages (unpaired t tests: α1, P = 0.017; α3, P = 0.0491; α4, P = 0.002; α5, P = 0.027). Numbers above columns are sample sizes.
Figure 3
Figure 3. Development of GABAAergic properties of cultured neocortical neurons
A, examples of whole-cell current responses to 1 s applications of 1 mM GABA (left) and spontaneously occurring mPSCs (right) at different times during development. B, development of peak whole-cell GABAAergic current (filled symbols). Dashed lines indicate developmental trend. C, proportion of neurons with observable mPSCs as a function of age in culture (5–6 observations for each time point). Vertical dashed line indicates point where half of the neurons exhibit mPSCs. All observations were carried out with 50 μM Ruthenium Red in the bathing solution to increase release probability. D, rates of mPSC occurrence in the presence (▪) and absence (○) of Ruthenium Red. Inset shows details for first week in culture. Data in B and D are median values and error bars represent half of the IQR.
Figure 4
Figure 4. Responses of excised membrane to GABA
A and B, patch currents evoked by 1 s pulses of GABA (1 mM, concentration time course indicated above each trace) at 2 DIV (A) and 8 DIV (B) illustrating the development of a fast component of desensitization in older cultures. Time constant values from exponential fits to relaxation phase of each response are shown below traces. The lengths of the horizontal lines indicate the relative contributions of each exponential component. C, there are no age-related changes in 10–90 % rise times of currents in patches exposed to 1 mM GABA (•); 10 mM GABA (○) induced significantly faster activation of receptors in young and old cultures. Each symbol represents the median of 3–6 observations; error bars give half the IQR. Straight line is regression for 1 mM GABA data.
Figure 5
Figure 5. Developmental changes in kinetic properties of GABAA receptor desensitization measured in excised patches
A–C, cumulative distributions of time constant values derived from fits of multiple exponential components to current relaxations evoked by applications of 1 or 10 mM GABA. The thin line shows data from a period prior to synaptogenesis in culture (n = 19 neurons) and the thick line shows data 1 week later (n = 22 neurons). D, the prominence of the fast (< 20 ms) component of desensitization gradually increases with age in culture. Filled symbols give median values and error bars show half the IQR value.
Figure 6
Figure 6. Comparison of patch currents evoked by brief (< 1.5 ms) and sustained (> 100 ms) pulses of 1 mM GABA
A–C, normalized GABA responses (averages of 3–7 responses each) in 3 patches of various ages are shown in the bottom portion of each panel. The timing of the GABA applications are shown by the two open-tip current traces at the top; brief and sustained applications (and the corresponding responses) are indicated by thick and thin traces, respectively. Divergence of traces was measured 20 ms after initial GABA application as shown in A. Arrowheads in C indicate fast desensitization reaching equilibrium over the first 20 ms of the response at a time when receptors are still insensitive to the time course of applied GABA. D, relative divergence (expressed as percentage of normalized peak current) did not depend on age in culture. E, fast time constants of current relaxations for brief (‘Short-pulse τ1‘) and sustained (‘Long-pulse τ1‘) pulses of GABA were correlated. Straight lines in D and E show regressions. F, frequency distribution of fast time constants for responses to long (open columns) and short (filled columns) pulses of GABA at a time during (7–10 DIV) and before (1–4 DIV) large scale synapse formation. A two-component Gaussian fit to the combined 7–10 DIV data revealed two populations of time constants (continuous lines, mean values 2.8 ms and 11.3 ms). Patches from 1–4 DIV neurons did not have a distinct population of < 5 ms time constants.
Figure 7
Figure 7. Time courses and exponential fits for GABAAergic mPSCs in two neocortical neurons
A, an individual mPSC (points) whose decay could only be fitted by a one-component exponential function. The continuous line indicates the fitted function. B, an mPSC which was successfully fitted by a two-component exponential. The separate components are shown in the inset. Numbers and lines below each panel indicate the values of the fitted exponential time constants and their relative contributions to the overall time course; 37 % of all mPSCs were successfully fitted with two-component exponentials. The remaining mPSCs were fitted with one-component functions.
Figure 8
Figure 8. Distributions of parameters describing GABAAergic mPSCs in cultures from three developmental periods
Each panel shows cumulative distributions of fitted parameters for neurons of three age groups: thin continuous lines represent data from neurons < = 4 DIV; dashed lines indicate data gathered between 7 and 10 DIV; thick continuous lines indicate data gathered between 14 and 17 DIV. A, distributions of peak amplitudes showing a significant increase during development. B, distributions of decay time constants for mPSC where only one exponential component could be fitted successfully. C, distributions of time constant values for two-component mPSCs. Data for the fast (τ1) and slow (τ2) time constant values are shown separately. D, distribution of percentage contribution of the fast component to the overall time course of decay for two-component mPSCs. There was a significant increase in the contribution of the fast component between 7–10 DIV and 14–17 DIV cultures.
Figure 9
Figure 9. Time constant values from exponential fits to noisy data can result in the misleading appearance of a developmental shift in kinetics
Two-component relaxations with added noise were reconstructed using median values from mPSC data. •, time constant values arising from one-component fits to these reconstructed data. There is an apparent developmental trend, although there was little or no developmental change in time constant values in the original data used for the reconstruction (cf. Fig. 8C). Instead, the changing prominence of fast decay (cf. Fig. 8D) creates a misleading impression of a shorter time constant when noise prevents a good two-component fit. ○, median values experimentally measured for one-component fits to genuine mPSCs (cf. Fig. 8B).
Figure 10
Figure 10. Comparison of the fast components of patch desensitization and mPSC decay in young (1–4 DIV) and older (7–10 DIV) cultures
A, cumulative distribution of the percentage of the fast component at a time when GABAA synapses were not common in the cultures. The fast component was less prominent in the data derived from GABA applications to patches (thin line) than in synaptic decays (thick line). B, the percentage of the fast component at a time when synapses are proliferating. The distributions at this stage are not significantly different. C, the time constant values of fast decay in 1–4 DIV synapses (columns) are more similar to those for 7–10 DIV patches (continuous curve) than for contemporaneous 1–4 DIV patches (dashed curve). The distributions indicated by the curves are from the Gaussian fits shown in Fig. 6F.
Figure 11
Figure 11. SB-205384, a GABA potentiator selective for GABAA receptors containing the α3 subunit, affects extrasynaptic, but not synaptic, receptors
A, bath application of SB-205384 (SB, horizontal bar) caused an inward current and an increase in noise in whole-cell recordings (holding potential, −60 mV). B, both effects were blocked by pretreatment with the GABAA receptor antagonist SR-95531 (SR, long horizontal bar). C, mPSCs collected before (Control) and during (SB) application of SB-205384 in the same cell show little difference in kinetics (fast and slow time constant values and their relative weight shown below traces; dashed lines show baseline). D, summary data for SB-205384 effects on mPSC parameters. Each symbol represents the median for 11 neurons. Upper and lower error bars show interquartile range. None of the parameters showed a significant effect of SB-205384.

Similar articles

Cited by

References

    1. Ben-Ari Y, Khazipov R, Leinekugel X, Caillard O, Gaiarsa JL. GABAA, NMDA and AMPA receptors: a developmentally regulated ‘menage a trois’. Trends in Neurosciences. 1997;20:523–529. - PubMed
    1. Berger T, Schwarz C, Kraushaar U, Monyer H. Dentate gyrus basket cell GABAA receptors are blocked by Zn2+ via changes of their desensitization kinetics: an in situ patch-clamp and single-cell PCR study. Journal of Neuroscience. 1998;18:2437–2448. - PMC - PubMed
    1. Brooks KA, Jin H, Price M, Dichter MA. Developmental expression of GABA(A) receptor subunit mRNAs in individual hippocampal neurons in vitro and in vivo. Journal of Neurochemistry. 1997;70:1017–1028. - PubMed
    1. Cauli B, Audinat E, Lambolez B, Angulo MC, Ropert N, Tsuzuki K, Hestrin S, Rossier J. Molecular and physiological diversity of cortical nonpyramidal cells. Journal of Neuroscience. 1997;17:3894–3906. - PMC - PubMed
    1. Dekoninck Y, Mody I. Noise analysis of miniature IPSCs in adult rat brain slices: properties and modulation of synaptic GABAA receptor channels. Journal of Neurophysiology. 1994;71:1318–1335. - PubMed

LinkOut - more resources