. 2000 Jan 4;97(1):38-43.
doi: 10.1073/pnas.97.1.38.

Exercise-induced changes in expression and activity of proteins involved in insulin signal transduction in skeletal muscle: differential effects on insulin-receptor substrates 1 and 2

Affiliations

Exercise-induced changes in expression and activity of proteins involved in insulin signal transduction in skeletal muscle: differential effects on insulin-receptor substrates 1 and 2

A V Chibalin et al. Proc Natl Acad Sci U S A. .

Abstract

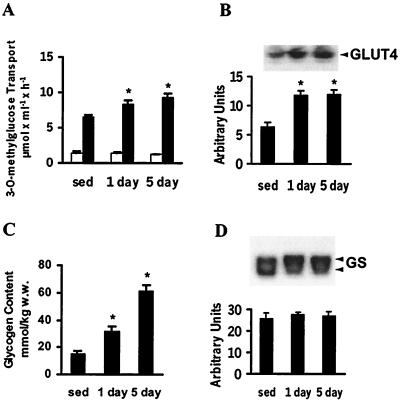
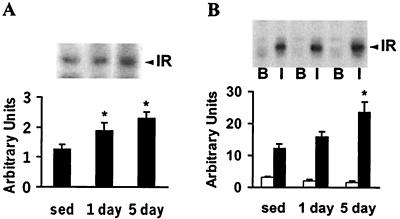
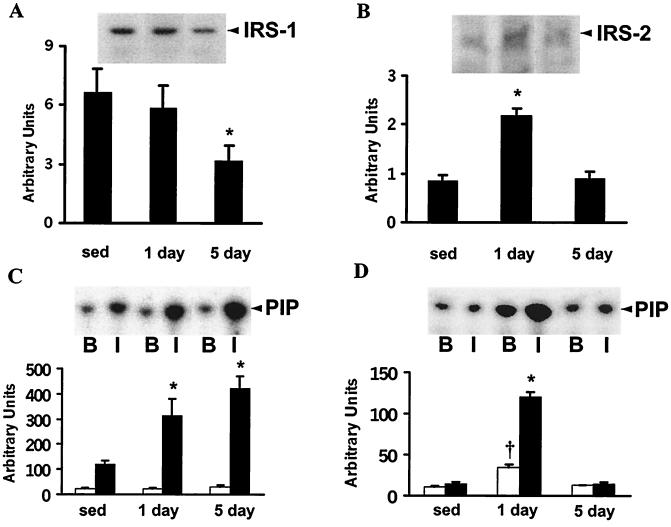
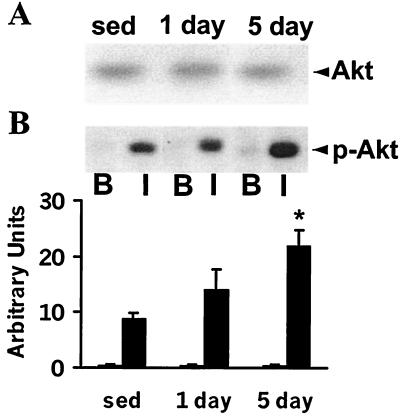
Level of physical activity is linked to improved glucose homeostasis. We determined whether exercise alters the expression and/or activity of proteins involved in insulin-signal transduction in skeletal muscle. Wistar rats swam 6 h per day for 1 or 5 days. Epitrochlearis muscles were excised 16 h after the last exercise bout, and were incubated with or without insulin (120 nM). Insulin-stimulated glucose transport increased 30% and 50% after 1 and 5 days of exercise, respectively. Glycogen content increased 2- and 4-fold after 1 and 5 days of exercise, with no change in glycogen synthase expression. Protein expression of the glucose transporter GLUT4 and the insulin receptor increased 2-fold after 1 day, with no further change after 5 days of exercise. Insulin-stimulated receptor tyrosine phosphorylation increased 2-fold after 5 days of exercise. Insulin-stimulated tyrosine phosphorylation of insulin-receptor substrate (IRS) 1 and associated phosphatidylinositol (PI) 3-kinase activity increased 2.5- and 3. 5-fold after 1 and 5 days of exercise, despite reduced (50%) IRS-1 protein content after 5 days of exercise. After 1 day of exercise, IRS-2 protein expression increased 2.6-fold and basal and insulin-stimulated IRS-2 associated PI 3-kinase activity increased 2. 8-fold and 9-fold, respectively. In contrast to IRS-1, IRS-2 expression and associated PI 3-kinase activity normalized to sedentary levels after 5 days of exercise. Insulin-stimulated Akt phosphorylation increased 5-fold after 5 days of exercise. In conclusion, increased insulin-stimulated glucose transport after exercise is not limited to increased GLUT4 expression. Exercise leads to increased expression and function of several proteins involved in insulin-signal transduction. Furthermore, the differential response of IRS-1 and IRS-2 to exercise suggests that these molecules have specialized, rather than redundant, roles in insulin signaling in skeletal muscle.


Figures

Figure 1
Figure 1
Insulin-stimulated 3-O-methylglucose transport, GLUT4 protein expression, glycogen concentration, and GS phosphorylation/protein expression in epitrochlearis muscle. (A) Sixteen hours after the last swim bout, epitrochlearis muscles from sedentary (sed) and 1- or 5-day-exercised rats were incubated with (filled bars) or without (open bars) 120 nM insulin, and 3-O-methylglucose transport was assessed. Values are mean ± SEM for 6 or 7 rats. (B) Muscle lysates (25 μg of protein) were subjected to SDS/PAGE and immunoblotted with polyclonal anti-GLUT4 antibody. (Upper) Representative GLUT4 immunoblot. Graph is mean ± SEM for 6 to 8 rats. (C) Glycogen content was assessed in muscle obtained as described for A. Graph is mean ± SEM for glycogen content for 6 or 7 rats. (D) Protein expression of GS in muscle lysates (50 μg) determined by immunoblot analysis with polyclonal anti-GS antibody. (Upper) Representative immunoblot of GS phosphorylation and expression in muscle. Phosphorylation was detected by reduced mobility of GS protein during SDS/PAGE (7.5% gel). Graph is mean ± SEM for GS protein expression in 6 or 7 rats. *, P < 0.05 vs. sedentary rats.
Figure 2
Figure 2
Protein expression and insulin-stimulated phosphorylation of IR β-subunit. Epitrochlearis muscles were obtained from rats described for Fig. 1A and incubated with or without 120 nM insulin (4 min). (A) Muscle lysates (50 μg) were subjected to SDS/PAGE (7.5% gels) and immunoblotted with monoclonal anti-IR antibodies. (Upper) Representative immunoblot of IR protein expression. Graph is mean ± SEM for 8 or 9 rats. (B) Tyrosine phosphorylation of IR. Muscle lysates (750 μg) were immunoprecipitated with polyclonal anti-phosphotyrosine antibody, subjected to SDS/PAGE (7.5% gels), and immunoblotted with a monoclonal anti-phosphotyrosine antibody. (Upper) Representative immunoblot of basal (B; open bar) and insulin-stimulated (I; filled bar) tyrosine phosphorylation of the IR. Graph is mean ± SEM for 5 or 6 rats. *, P < 0.05 vs. sedentary rats (sed).
Figure 3
Figure 3
IRS protein expression and PI 3-kinase activity. Epitrochlearis muscles were incubated as described in the legend of Fig. 2 and lysates were prepared. (A) Lysates from non-insulin-stimulated muscle (50 μg) were to subjected to SDS/PAGE (7.5% gels) and immunoblotted with a monoclonal anti-IRS-1 antibody. (Upper) Representative immunoblot of IRS-1 expression. Graph is mean ± SEM for 8 or 9 rats. (B) Lysates were subjected to SDS/PAGE as described for A and immunoblotted with a polyclonal anti-IRS-2 antibody. (Upper) Representative immunoblot of IRS-2 expression. Graph is mean ± SEM for 8 or 9 rats. (C) Lysates (500 μg) were immunoprecipitated with polyclonal anti-IRS-1 antibody and PI 3-kinase activity was assessed. Incorporation of 32P into PI-3-phosphate for basal (B; open bar) or insulin-stimulated (I; filled bar) muscle was assessed with a phosphorimager. (Upper) Representative phosphorimage. Graph is mean ± SEM for 7 to 9 rats. (D) Lysates (750 μg) were immunoprecipitated with polyclonal anti-IRS-2 antibody and PI 3-kinase activity was assessed. (Upper) Representative phosphorimage. Graph is mean ± SEM for 3 or 4 rats. For A and B, *, P < 0.05 vs. sedentary rats. For C and D, *, P < 0.05 vs. insulin-stimulated muscle from sedentary rats; †, P < 0.05 vs. non-insulin-stimulated muscle from sedentary rats.
Figure 4
Figure 4
Akt protein expression and phosphorylation. Muscles were incubated with or without 120 nM insulin (30 min). Muscle lysates (40 μg) were subjected to SDS/PAGE (10% gels) and immunoblotted with a polyclonal anti-Akt antibody (A: measuring expression) or a phospho-specific polyclonal anti-p-Akt antibody (B: measuring phosphorylation). A representative immunoblot of basal (B) and insulin-stimulated (I) Akt phosphorylation is shown. Graph is mean ± SEM for basal (open bar) and insulin-stimulated (filled bar) conditions for 5 or 6 rats. *, P < 0.05 vs. sedentary rats.

References

    1. Zierath J R. Acta Physiol Scand. 1995;155,(Suppl. 626):1–96. - PubMed
    1. Devlin J T, Hirshman M, Horton E D, Horton E S. Diabetes. 1987;36:434–439. - PubMed
    1. Wallberg-Henriksson H. Acta Physiol Scand. 1987;131,(Suppl. 564):1–80. - PubMed
    1. Richter E A, Garetto L P, Goodman M N, Ruderman N B. J Clin Invest. 1982;69:785–793. - PMC - PubMed
    1. Wallberg-Henriksson H, Constable S H, Young D A, Holloszy J O. J Appl Physiol. 1988;65:909–913. - PubMed

Publication types

MeSH terms