. 2000 Jan 4;97(1):127-32.
doi: 10.1073/pnas.97.1.127.

Pulling a single chromatin fiber reveals the forces that maintain its higher-order structure

Affiliations

Pulling a single chromatin fiber reveals the forces that maintain its higher-order structure

Y Cui et al. Proc Natl Acad Sci U S A. .

Abstract

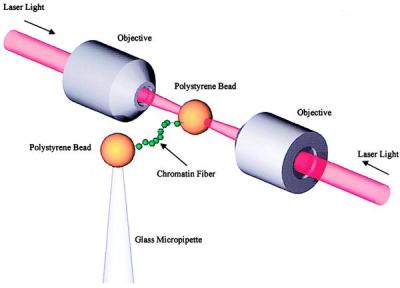
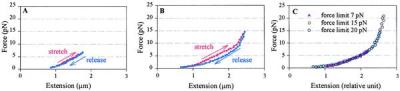
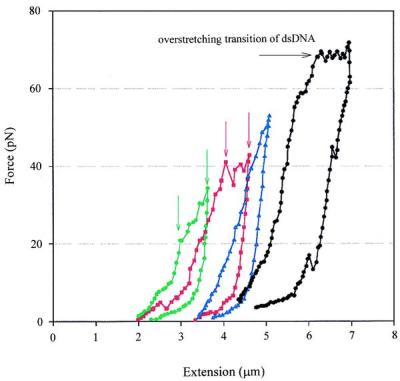
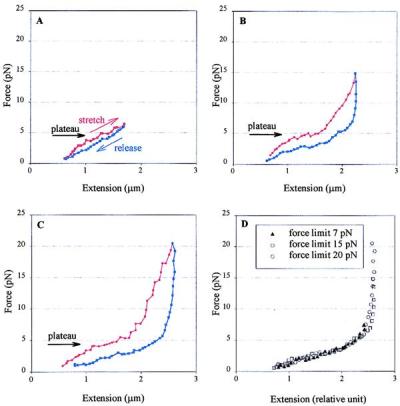
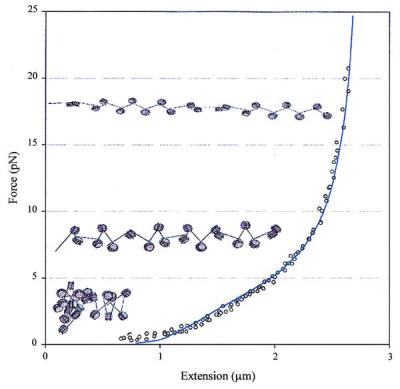
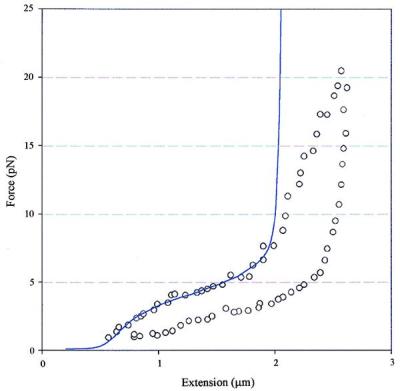
Single chicken erythrocyte chromatin fibers were stretched and released at room temperature with force-measuring laser tweezers. In low ionic strength, the stretch-release curves reveal a process of continuous deformation with little or no internucleosomal attraction. A persistence length of 30 nm and a stretch modulus of approximately 5 pN is determined for the fibers. At forces of 20 pN and higher, the fibers are modified irreversibly, probably through the mechanical removal of the histone cores from native chromatin. In 40-150 mM NaCl, a distinctive condensation-decondensation transition appears between 5 and 6 pN, corresponding to an internucleosomal attraction energy of approximately 2.0 kcal/mol per nucleosome. Thus, in physiological ionic strength the fibers possess a dynamic structure in which the fiber locally interconverting between "open" and "closed" states because of thermal fluctuations.


Figures

Figure 1
Figure 1
Schematic drawing of a chromatin fiber pulled between two beads by laser tweezers (19) formed by two laser beams counter-propagating through the objectives with a common focus, not to scale. The stiffness of the trap is ≈28 pN/μm. The Brownian noise in the force ≈0.34 pN, which is also close to the thermal drift.
Figure 2
Figure 2
Force-extension curves of chicken erythrocyte chromatin fibers at low and intermediate force regimes in 5 mM NaCl, 10 mM Tris (pH 7.5), 2 mM EDTA, 2 mg/ml BSA. (A) In the low force regime, below 6 pN, the stretch release curves are repeatable and reversible with a positive curvature. (B) Between 6 and 20 pN the stretch and release curves no longer coincide and hysteresis is evident in the cycle. (C) Shown are the relaxation curves, adjusted to the same length by a constant factor, corresponding to a fiber stretched in three cycles with different maximum forces.
Figure 3
Figure 3
Force-induced irreversible changes in chromatin fibers successively extended to increasing forces well above 20 pN in 5 mM NaCl, 10 mM Tris (pH 7.5), 2 mM EDTA, 2 mg/ml BSA. Hysteresis between the stretch and release part of the curve is evident in all curves. During the first stretch-release cycle (green) the fiber undergoes a transition that appears between 20 and 35 pN (between the green vertical arrows). In the successive cycles this transition occurs at higher forces (red curve and red vertical arrows) and eventually become less noticeable (blue curve). When the fiber is stretched up to ≈65 pN, a plateau corresponding to the overstretching of dsDNA can be seen (black curve and horizontal arrow).
Figure 4
Figure 4
Force-extension curves for chicken erythrocyte chromatin fibers pulled below 20 pN in 40 mM NaCl, 10 mM Tris (pH 7.5), 2 mM EDTA, 2 mg/ml BSA. (A) In low force regime, the stretch and release halves of the cycle nearly coincide. (B and C) Intermediate force regime. The stretch and release curves no longer coincide and the process displays hysteresis. The plateau corresponding to the condensation-decondensation transition is indicated by the horizontal arrows. (D) Three relaxation curves, adjusted to the same length by using a constant factor, corresponding to a fiber stretched successively to different maximum forces. The negative curvature and the plateau although less obvious, are still present.
Figure 5
Figure 5
Fit of the release part of the force-extension curve of a chromatin fiber at low ionic strength by using an extensible worm-like chain model. Fitting of the data gives a persistence length of 30 nm, a stretch modulus of 5 pN, and a maximum length of 3.05 times the original fiber length, estimated to be 1 μm based on the x-intercept of the linear part of the curve. The fiber attains its maximum length when the linkers become completely aligned in the direction of the applied force. For reference, the chromatin models, schematic drawing depicting qualitatively the continuous deformation of the chromatin fiber as it is subjected to increasing tension at low ionic strengths, have been superimposed to the relaxation curve of a fiber pulled under those conditions.
Figure 6
Figure 6
Fit of chromatin decondensation data by a two-state model. A persistence length of 30 nm is assumed for both before and after the transition (either side of the plateau). A contour length of 0.7 μm was used for the condensed fiber (short form), whereas the contour length for the decondensed fiber (long form) is assumed to be two times longer. The energy to convert the short form to long form is found to be 3.8 kT from the fit. The divergence between the experimental values (○) and the calculated values (solid line) at high forces results from the inextensible nature of the model.

References

    1. Simpson R T. Biochemistry. 1978;17:5524–5531. - PubMed
    1. Bednar J, Horowitz R A, Dubochet J, Woodcock C L. J Cell Biol. 1995;131:1365–1376. - PMC - PubMed
    1. Pruss D, Bartholomew B, Persinger J, Hayes J, Arents G, Moudrianakis E N, Wolffe A P. Science. 1996;274:614–617. - PubMed
    1. Hamiche A, Schultz P, Ramakrishnan V, Oudet P, Prunell A. J Mol Biol. 1996;257:30–42. - PubMed
    1. Richmond T J, Finch J T, Rushton B, Rhodes D, Klug A. Nature (London) 1984;311:532–537. - PubMed

Publication types

LinkOut - more resources