. 2000 Jan 4;97(1):139-44.
doi: 10.1073/pnas.97.1.139.

Solid-state synthesis and mechanical unfolding of polymers of T4 lysozyme

Affiliations

Solid-state synthesis and mechanical unfolding of polymers of T4 lysozyme

G Yang et al. Proc Natl Acad Sci U S A. .

Abstract

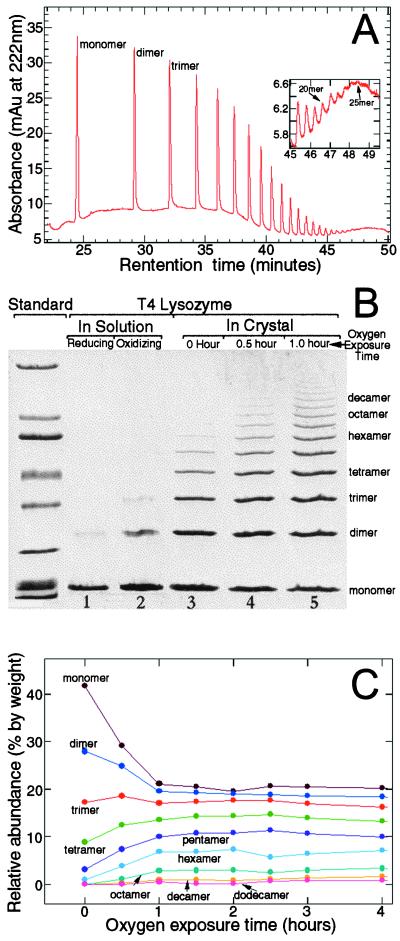
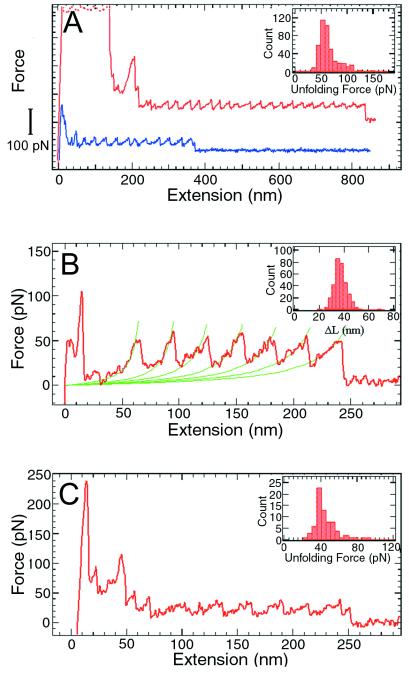
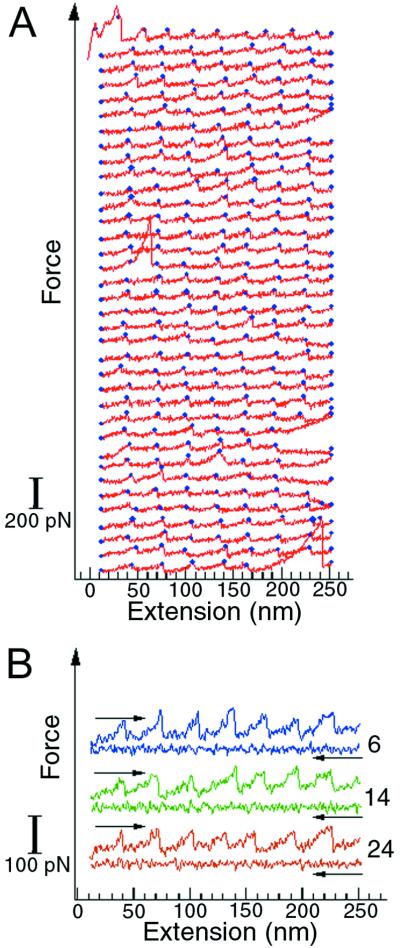
Recent advances in single molecule manipulation methods offer a novel approach to investigating the protein folding problem. These studies usually are done on molecules that are naturally organized as linear arrays of globular domains. To extend these techniques to study proteins that normally exist as monomers, we have developed a method of synthesizing polymers of protein molecules in the solid state. By introducing cysteines at locations where bacteriophage T4 lysozyme molecules contact each other in a crystal and taking advantage of the alignment provided by the lattice, we have obtained polymers of defined polarity up to 25 molecules long that retain enzymatic activity. These polymers then were manipulated mechanically by using a modified scanning force microscope to characterize the force-induced reversible unfolding of the individual lysozyme molecules. This approach should be general and adaptable to many other proteins with known crystal structures. For T4 lysozyme, the force required to unfold the monomers was 64 +/- 16 pN at the pulling speed used. Refolding occurred within 1 sec of relaxation with an efficiency close to 100%. Analysis of the force versus extension curves suggests that the mechanical unfolding transition follows a two-state model. The unfolding forces determined in 1 M guanidine hydrochloride indicate that in these conditions the activation barrier for unfolding is reduced by 2 kcal/mol.


Figures

Figure 1
Figure 1
Crystal structure of T4 lysozyme. (A) The vicinity of the engineered intermolecular disulfide bridge. The atoms shown in the lower half of the figure are from one lysozyme molecule. The atoms at the top (labeled with *) are from a neighboring molecule in the crystal. The superimposed electron density is from a 1.9-Å resolution map with coefficients (2Fo-Fc). Fo corresponds to the observed structure amplitudes. The calculated structure factors, Fc, and phases were from the model refined, assuming that there is no disulfide bridge between Cys-21 and Cys-124*. As can be seen, the electron density suggests that Cys-21 occupies two alternative positions, one of which corresponds to the oxidized and the other to the reduced form. Additional density extending from Cys-124* was modeled in the refinement as a water molecule (shown in red) but could represent a partial adduct with β-mercaptoethanol. The double mutant T21C/K124C/WT* was obtained as described (17) except that 0.01 M β-mercaptoethanol was present in the column and storage buffers. The protein crystals were grown by vapor diffusion at 5°C as hanging drops as described (18) except that 0.14 M β-mercaptoethanol was present during crystallization. X-ray data to 1.8-Å resolution (88% complete) were collected from 5-day-old crystals. The structure was refined to an R factor of 18.5% with bond length and angle discrepancies of 0.019 Å and 2.6°, respectively. The coordinates have been deposited in the Protein Data Bank, ID code 1B6I. (B) Arrangement of three T4 lysozyme molecules within the crystal lattice, related to each other by a 21 screw axis.
Figure 2
Figure 2
Characterization of T4 lysozyme polymers from dissolved crystals. (A) Polymers as detected by capillary electrophoresis. After exposure to oxygen for 23 days, protein crystals were dissolved in CE-SDS Protein Kit Sample Buffer (Bio-Rad). Samples were loaded with pressure (50 mbar × 50 sec) and run at constant voltage (−20 kV) at a nominal temperature of 20°C. Detection was by means of absorbance at 220 nm. (B) Polyacrylamide-SDS gel (4–15% gradient) showing degrees of polymerization of T4 lysozyme molecules obtained under different conditions. Lane 1 shows the polymerization achieved in solution under reducing conditions (0.55 M NaCl, 0.1 M Na3PO4, 0.02% Na3N, and 0.05 M DTT, pH 6.5). The protein concentration was 0.75 mg/ml. Lane 2 shows the polymerization obtained in solution under oxidizing conditions (0.55 M NaCl, 0.1 M NaPO4, 0.02% Na3N, pH 6.5, exposed to pure oxygen for 5 weeks). Lanes 3–5 show the degree of polymerization in the crystals after different times of oxygen exposure. To expose the crystals to oxygen, the hanging drops and well buffer were transferred to individual vials after crystallization. With the coverslips ajar, these vials then were placed in an oxygen-filled glass desiccator at room temperature. Pure oxygen gas was supplied to the desiccator valve at a flow rate of about 0.5 cc/min after being humidified by passage through 500 ml of well buffer. The oxygen flow removed the mercaptoethanol from the drops and the oxygen/mercaptoethanol mixture was allowed to escape through a paper gasket between the ground glass mating surfaces of the desiccator lid and body. SDS/PAGE broad range molecular weight standards (Bio-Rad) were used. (C) The relative abundance of different polymer species as a function of the oxygen exposure time. For clarity, not all polymer species are shown. The gels were scanned into a computer and the volume of each band was determined with imagequant (Molecular Dynamics). The relative abundance is the ratio of the volume of a particular band to the total volume of all the bands in a lane.
Figure 3
Figure 3
Images of T4 lysozyme molecules obtained with the SFM. The overall size of each image field is 500 nm × 500 nm. (A) Polymers of T4 lysozyme molecules from dissolved crystals (exposed to oxygen for 30 days). The dimensions of the extended features indicate that they are polymers with lengths up to 30 monomers. (B) Monomeric T4 lysozyme molecules. The globular features have typical diameters of ≈8 nm and heights of ≈2 nm, which are consistent with that of a folded T4 lysozyme molecule because the lateral dimensions of the molecule are overestimated in the image because of the finite size of the SFM tip. If a T4 molecule is approximated as a sphere with a radius of 1.8 nm, its image will have radii of 4 nm in the lateral dimensions when imaged with a tip with a radius of curvature of 10 nm. In these experiments, 20 μl of protein solution (in PBS buffer) was deposited on freshly cleaved mica and allowed to adsorb for 10 min. The sample then was washed with the same buffer and dried with nitrogen gas. Imaging was performed in air by using a Nanoscope SFM (Digital Instruments, Santa Barbara, CA) operating in the tapping mode.
Figure 4
Figure 4
The thermal stability of monomeric (+, Tm = 49.5oC, ΔH = 110 kcal/mol) and polymeric (○, apparent Tm = 40.0oC, apparent ΔH = 50 kcal/mol) T21C/K124C/WT* T4 lysozyme. Monomeric and polymeric samples were thermally unfolded (18) in 20 mM glycine-HCl, 1 mM H4EDTA, pH 3.05, with protein concentrations of 15 and 10 μM (in residue), respectively. The changes in the CD signal at 223 nm were analyzed as two-state transitions (solid curves). CD signals returned to in excess of 95% of their starting values upon cooling but approximately 10% of the polymeric sample adhered to the wall of the cuvette. The van't Hoff enthalpy at the apparent Tm for the polymeric sample is about 50% of the value expected on the basis of enthalpy changes with Tm of other T4 lysozyme mutants. The low value of ΔH for the polymeric sample likely reflects both heterogeneity inherent in a mixture as well as a loss of solubility of some of the material. The polymeric sample is less stable than the monomer. The change in ΔΔG relative to monomeric T21C/K124C/WT* is −3.5 kcal/mol with uncertainty likely ±1 kcal/mol.
Figure 5
Figure 5
Force vs. extension curves obtained by stretching single T4 lysozyme polymers between a silicon nitride probe and a gold surface. (A) Two force curves obtained in 10× PBS (1,260 mM NaCl, 72 mM Na2HPO4, 30 mM NaH2PO4, adjusted to pH 7.0 with HCl). The curves are shifted in the vertical direction for clarity. Each curve has its own zero force level, which is the rightmost part of the curve where the polymer is either detached or broken. The high force features at the beginning were caused by nonspecific interactions between the probe and the surface. Inset, histogram of the unfolding forces (n = 443). (B) The force curve with the stretching parts fitted to the worm-like-chain model (3, 4). The contour length increments from the unfolding of a single lysozyme molecule were obtained from the fitting. (B Inset) Histogram (n = 328) of contour length increments, ΔL = 36 ± 5 nm. When the protein unfolds following the “two-state” model, each unfolding event will lengthen the polymer by an amount equal to the unfolded (contour) length between the two attachment points (i.e., the two linking cysteine residues) minus the distance of the two points in the folded protein. This contour length increase is not equal to the distance between adjacent peaks in the force curve because the polymer is never fully stretched. For T4 lysozyme, there are 103 aa between the two attachment points at positions 21 and 124. The distance between adjacent α-carbon atoms is 0.38 nm, but the tetrahedral geometry reduces the maximal extension of a polypeptide chain to about 0.34 nm per residue (i.e., in a fully extended β-sheet conformation). In the folded protein, the distance between sites 21 and 124 is 3.15 nm. Thus the contour length increase upon unfolding of one lysozyme molecule is (103 × 0.34) − 3.15 ≅ 32 nm. (C) A force curve obtained in 1 M GuHCl. (C Inset) Histogram of the unfolding forces (n = 73, pulling speed = 1,000 nm/sec). When a polymer is stretched in the absence of GuHCl, one monomer unfolds every 0.03 sec (average distance between adjacent peaks/pulling speed = 30 nm/1,000 nm per sec = 0.03 sec), corresponding to a rate constant of 33.3 sec−1. The free energy that has to be supplied from pulling is ΔΔG = RT ln(k1/k2), where k2 is the spontaneous rate constant of unfolding and k1 is the rate constant when pulled. In the absence of GuHCl, k2 = 10−4 sec−1 (19) and k1 = 33.3 sec−1, so ΔΔG = RT ln(k1/k2) = 7.6 kcal⋅M−1. Using the relation ΔΔG = F Δx (3), and the average unfolding force of F = 64 pN, we get Δx = ΔΔG/F = 0.81 nm. In 1.0 M GuHC, the average unfolding force is F = 44 pN. Assuming that Δx is the same, the reduction in the unfolding barrier is: (62–44) pN × 0.81 nm = 2.1 kcal⋅M−1.
Figure 6
Figure 6
Repeated unfolding-refolding of T4 lysozyme molecules in a polymer. The curves were obtained by stretching and relaxing the same polymer multiple times. (A) The unfolding traces of the unfolding-refolding cycles. The blue dots mark the positions where unfolding occurs. Three complete unfolding and refolding cycles are shown in B. The numbers on the right indicate the order of the curves in the sequence displayed in A. The force curves in these plots are shifted vertically for clarity, so they do not share a common zero force level.

References

    1. Kellermayer M S, Smith S B, Granzier H L, Bustamante C. Science. 1997;276:1112–1116. - PubMed
    1. Tskhovrebova L, Trinick J, Sleep J A, Simmons R M. Nature (London) 1997;387:308–312. - PubMed
    1. Rief M, Gautel M, Oesterheld F, Fernandez J M, Gaub H E. Science. 1997;276:1109–1112. - PubMed
    1. Oberhauser A F, Marszalek P E, Erickson H P, Fernandez J M. Nature (London) 1998;393:181–185. - PubMed
    1. Carrion-Vazquez M, Oberhauser A F, Fowler S B, Marszalek P E, Broedel S E, Clarke J, Fernandez J M. Proc Natl Acad Sci USA. 1999;96:3694–3699. - PMC - PubMed

Publication types

Associated data

LinkOut - more resources