. 2000 Jan 3;191(1):23-32.
doi: 10.1084/jem.191.1.23.

Precursor B cell receptor-dependent B cell proliferation and differentiation does not require the bone marrow or fetal liver environment

Affiliations

Precursor B cell receptor-dependent B cell proliferation and differentiation does not require the bone marrow or fetal liver environment

A G Rolink et al. J Exp Med. .

Abstract

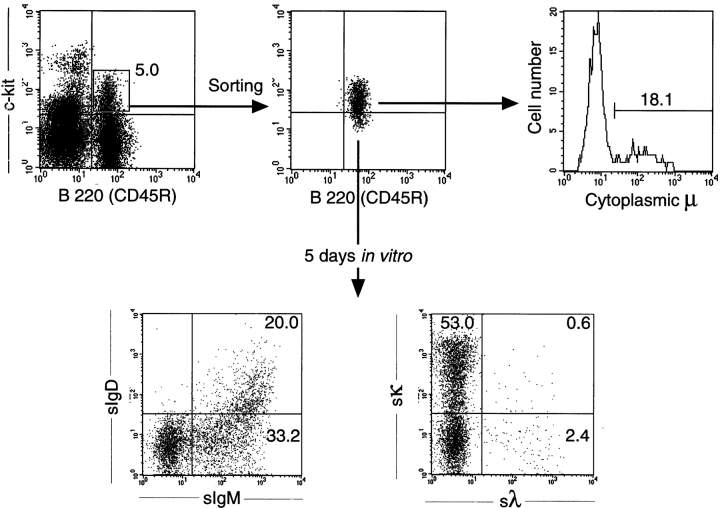
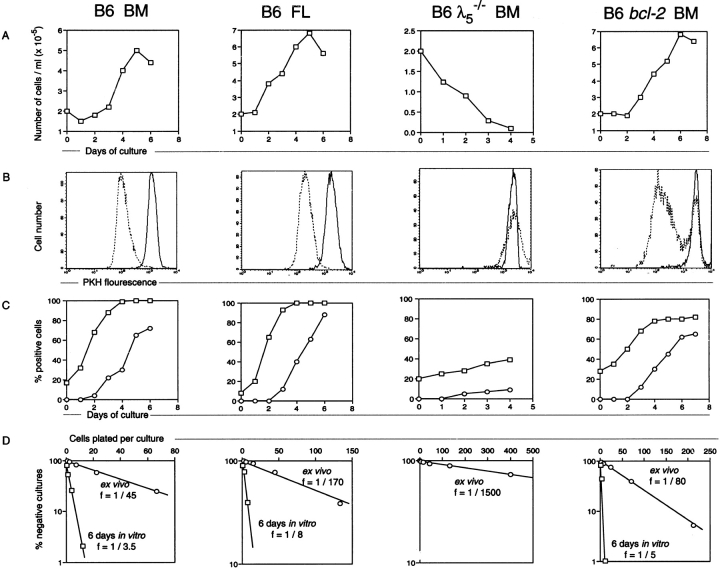
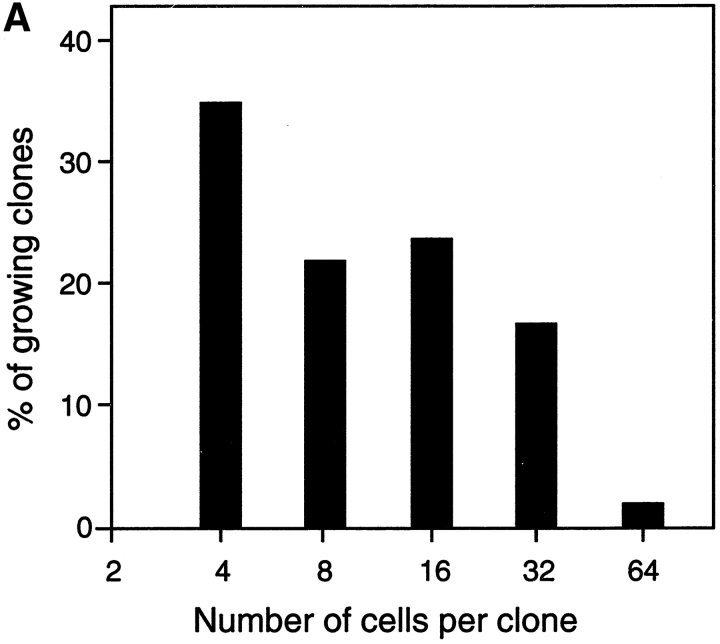
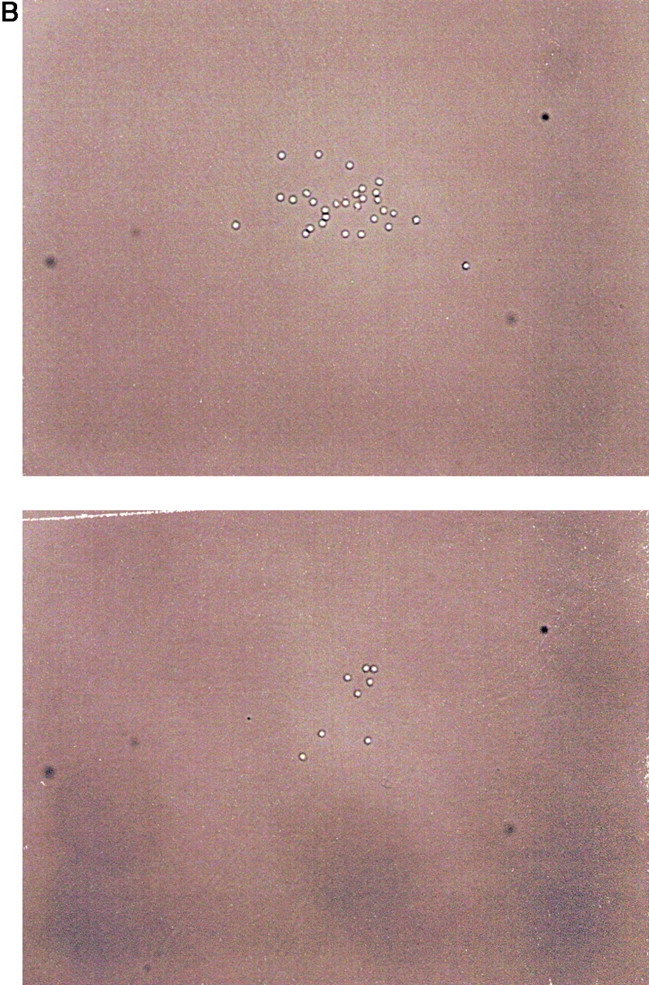
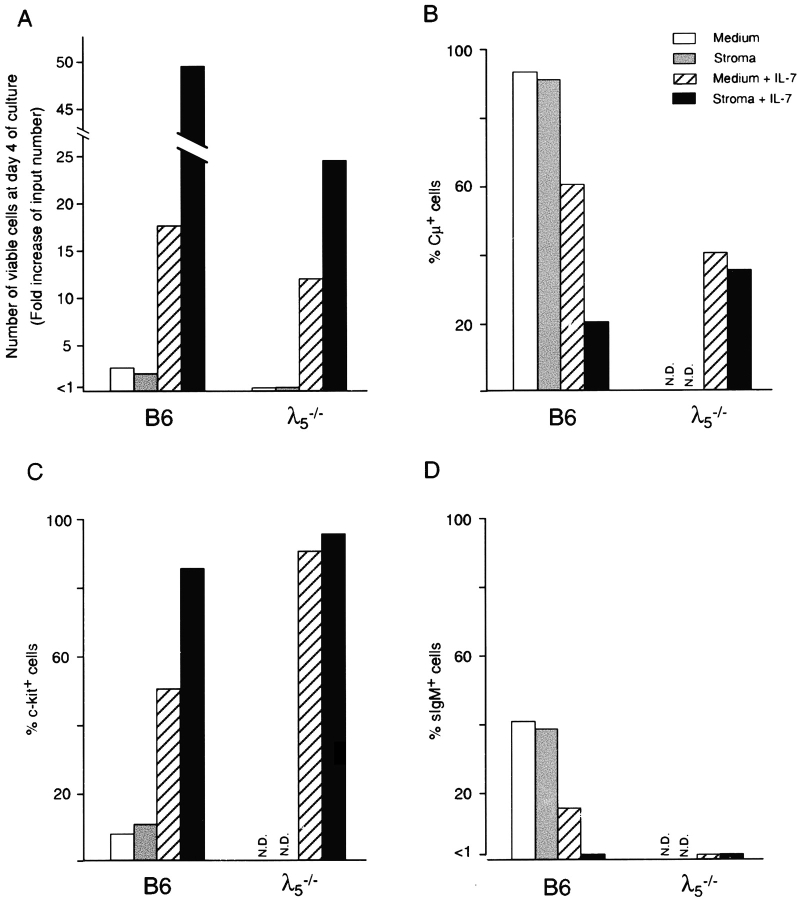
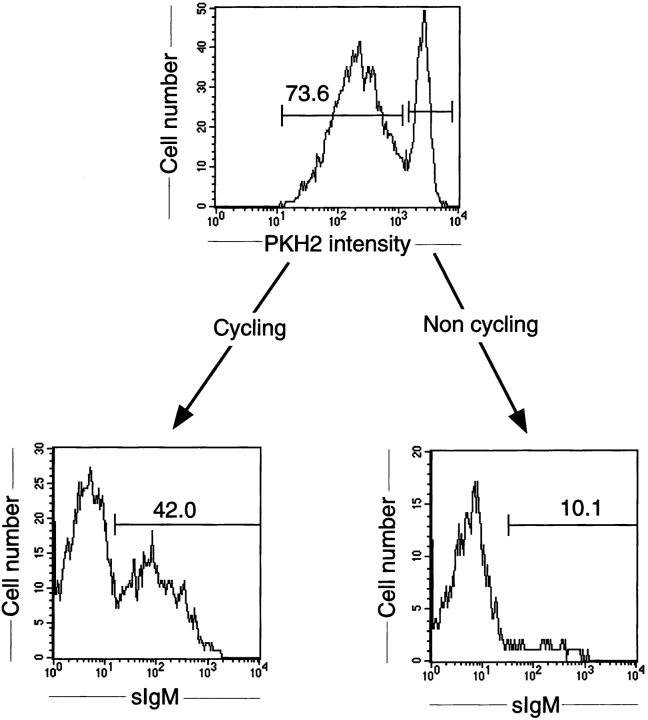
The capacity of precursor B (pre-B) I cells from fetal liver and bone marrow to proliferate and differentiate into surface immunoglobulin-positive immature B cells in vitro was analyzed. Both fetal liver- and bone marrow-derived progenitors do so in a pre-B cell receptor (pre-BCR)-dependent manner in tissue culture medium alone, without addition of other cells or cytokines. Approximately 20% of the initial pre-B I cells enter more than one division. Analyses at the single-cell level show that approximately 15% divide two to five times. Coculture of pre-B I cells with stromal cells did not enhance proliferation or differentiation, whereas the presence of interleukin 7, especially in combination with stromal cells, resulted mainly in the expansion of pre-B I cells and prevented their further differentiation. Thus, the environment of fetal liver or bone marrow is not required for the pre-BCR to exert its function, which is to select and expand cells that have undergone an inframe V(H)-D(H)J(H) rearrangement that produces a pre-BCR-compatible muH chain. It appears unlikely that a ligand for the pre-BCR drives this pre-B cell proliferation.


Figures

Figure 1
Figure 1
Sorting and phenotypic analyses of bone marrow pre-B I cells. Bone marrow cells from B6 mice were depleted of sIg+ cells by magnetic separation, but not enriched for CD19+ cells, and thereafter double stained with Cy5-labeled anti-B220 and biotin-labeled anti–c-kit for sorting (top left) and reanalyses of sorted cells (top middle). Staining for CD19-expressing cells revealed >95% positive cells (data not shown). Some of the sorted cells were permeabilized and stained with a polyclonal FITC-labeled goat anti-IgM for determination of cμ chain content (top right). After 5 d of culture, viable cells were double stained for surface IgM/IgD (bottom left) and surface κ/λ L chains (bottom right).
Figure 2
Figure 2
Proliferation and differentiation of sorted pre-B I cells. CD19+B220+c-kit+ pre-B I cells from bone marrow (BM) and day 17 fetal liver (FL) of wild-type, bone marrow of λ5 –/–, and bone marrow of bcl-2 transgenic B6 mice. (A) Viable cell recovery. (B) Cellular division as revealed by the decrease of PKH2 fluorescent intensity after 6 d (wild-type B6 bone marrow and fetal liver and bcl-2 transgenic bone marrow) or 4 d (B6 λ5 −/ bone marrow) of culture (dotted line), compared with the intensity of the starting population (solid line histogram). (C) Expression of cytoplasmic μH chain (□) and sIgM (○). (D) LPS reactivity before (○) and after (□) 6 d of culture as analyzed by limiting dilution analysis.
Figure 3
Figure 3
Clonal growth of single CD19+B220+c-kit+ pre-B I cells. Single pre-B I cells were sorted from bone marrow of wild-type B6 mice and grown for 5 d, at which time cultures containing more than two cells were considered to be growing, and the number of cells per clone was determined. (A) The data are presented as a histogram of the percentage of growing clones with a given size (4, 8, 16, or 32 cells). However, not all cultures containing growing clones have this exact number of cells, but fall around that value, allowing us to categorize a given clone. (B) 2 different representative clones from the above experiment are shown, one with 32 cells, and the other containing 8 cells.
Figure 3
Figure 3
Clonal growth of single CD19+B220+c-kit+ pre-B I cells. Single pre-B I cells were sorted from bone marrow of wild-type B6 mice and grown for 5 d, at which time cultures containing more than two cells were considered to be growing, and the number of cells per clone was determined. (A) The data are presented as a histogram of the percentage of growing clones with a given size (4, 8, 16, or 32 cells). However, not all cultures containing growing clones have this exact number of cells, but fall around that value, allowing us to categorize a given clone. (B) 2 different representative clones from the above experiment are shown, one with 32 cells, and the other containing 8 cells.
Figure 5
Figure 5
The effects of stromal cells and/or IL-7 on proliferation and differentiation of bone marrow–derived pre-B I cells. Bone marrow pre-B I cells from adult B6 and λ5 −/− mice were sorted as described in the legend to Fig. 1, but after enrichment for CD19+ cells. Sorted cells were plated at 2 × 10⁵ cells per ml in medium alone or on 3,000 rad–irradiated ST-2 stromal cells, or at 5 × 10⁴ cells per ml in medium containing 100 U/ml of recombinant mouse IL-7 in the absence or presence of 3,000 rad–irradiated ST-2 stromal cells, as indicated. After 4 d of culture, cells were harvested and viable cell counting (A), cell surface staining (C and D), and cytoplasmic staining (B) for indicated markers were performed as described in Materials and Methods.
Figure 4
Figure 4
Phenotypic analyses of dividing and nondividing pre-B cells. Sorted pre-B I cells from bone marrow of bcl-2 transgenic B6 mice were labeled with the green fluorescent dye PKH2-GL and cultured in vitro for 6 d. For analyses of sIgM, cells were stained with biotin-labeled M41 revealed by PE-labeled streptavidin. The top histogram shows cells that have undergone proliferation (Cycling) with decreased PKH2 green fluorescent intensity, and those expressing the same high PKH2 intensity (Non cycling) as the initially seeded population (see also Fig. 2 B). By gating on PKH2 high and low, respectively, after staining for sIgM, the bottom two histograms were obtained.

Comment in

References

    1. Kincade P.W. Formation of B lymphocytes in fetal and adult life. Adv. Immunol. 1981;31:177–245 . - PubMed
    1. Ehlich A., Martin V., Müller W., Rajewsky K. Analysis of the B-cell progenitor compartment at the level of single cells. Curr. Biol. 1994;4:573–583 . - PubMed
    1. ten Boekel E., Melchers F., Rolink A. The status of Ig loci rearrangements in single cells from different stages of B cell development. Int. Immunol. 1995;7:1013–1019 . - PubMed
    1. Melchers F., Rolink A., Grawunder U., Winkler T.H., Karasuyama H., Ghia P., Andersson J. Positively and negatively selecting events during B lymphopoiesis. Curr. Opin. Immunol. 1995;7:214–227 . - PubMed
    1. Kitamura D., Kudo A., Schaal S., Müller W., Melchers F., Rajewsky K. A critical role of λ5 in B cell development. Cell. 1992;69:823–831 . - PubMed

Publication types