. 2000 Jan 3;191(1):115-28.
doi: 10.1084/jem.191.1.115.

Virulent strains of Helicobacter pylori demonstrate delayed phagocytosis and stimulate homotypic phagosome fusion in macrophages

Affiliations

Virulent strains of Helicobacter pylori demonstrate delayed phagocytosis and stimulate homotypic phagosome fusion in macrophages

L A Allen et al. J Exp Med. .

Abstract

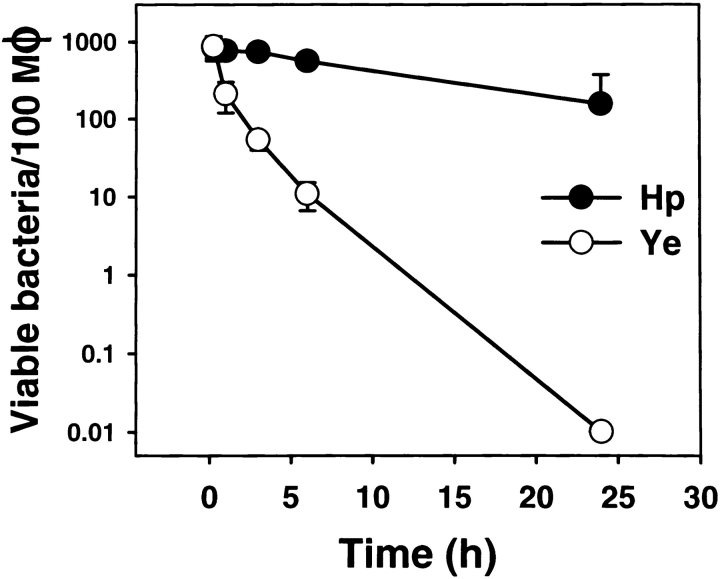
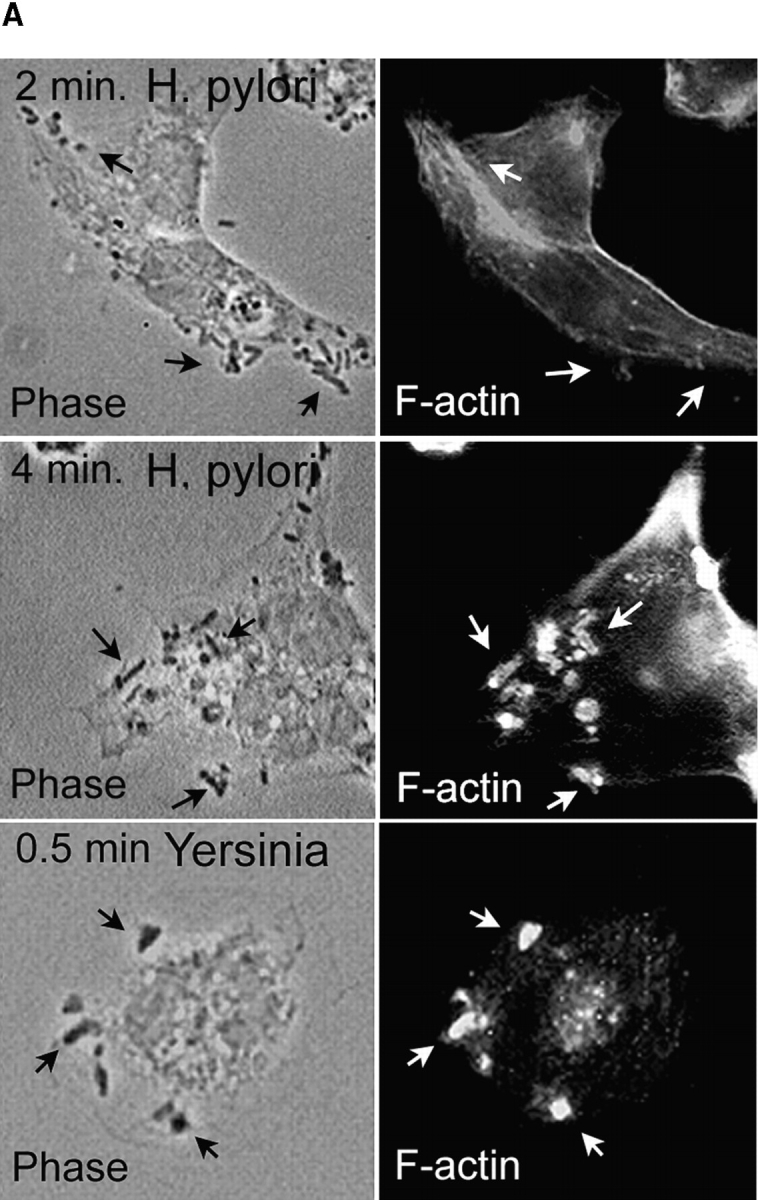
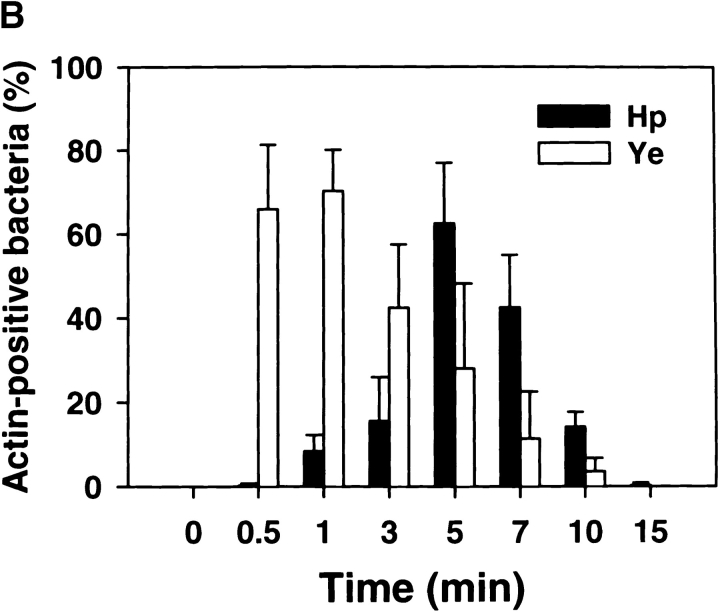
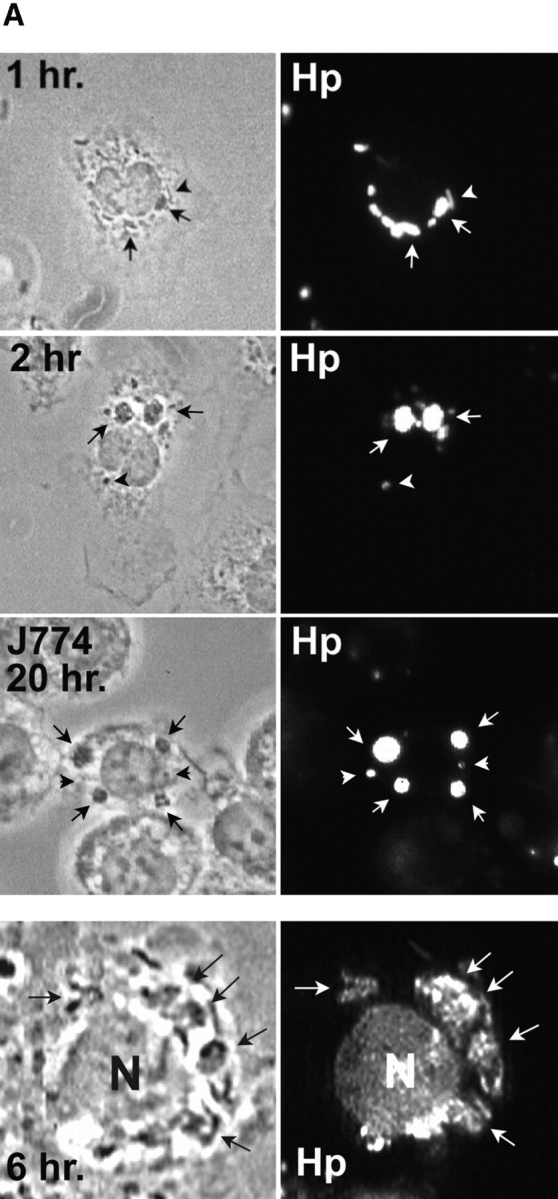
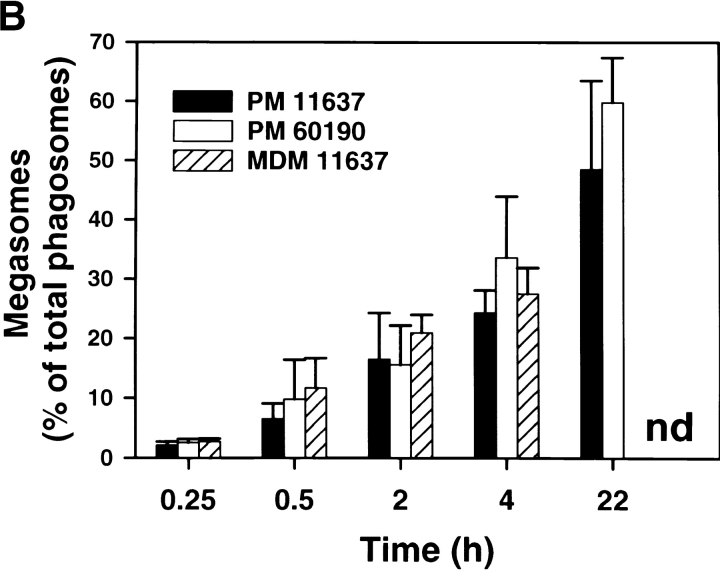
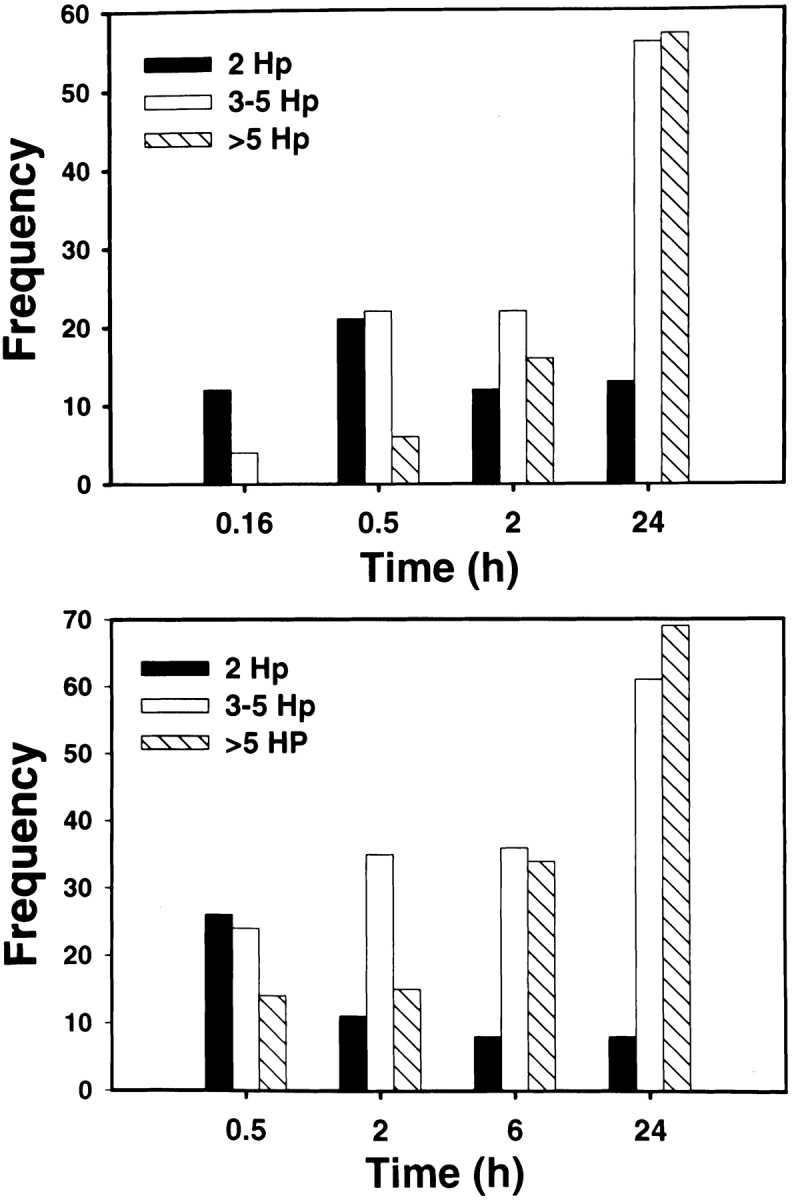
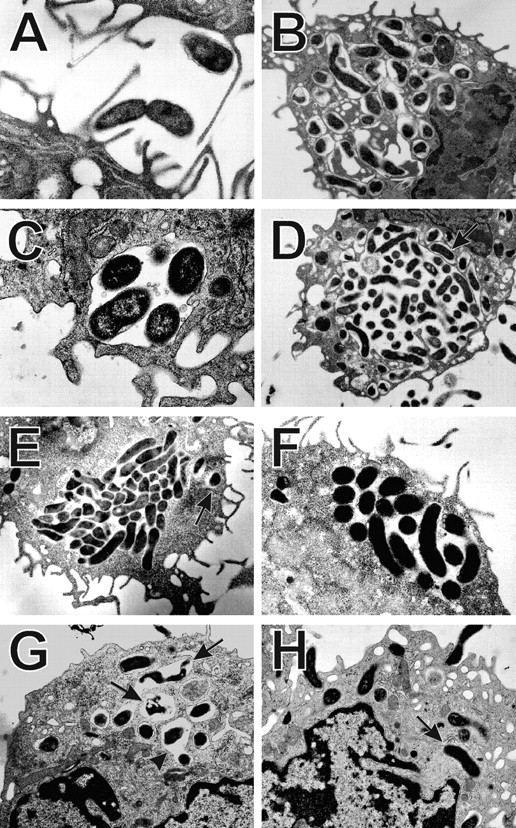
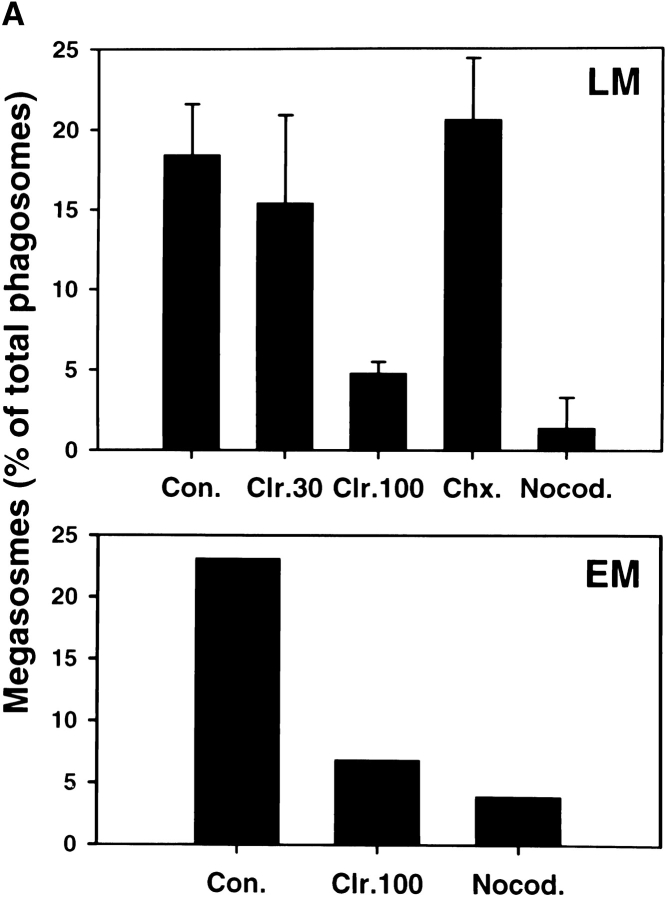
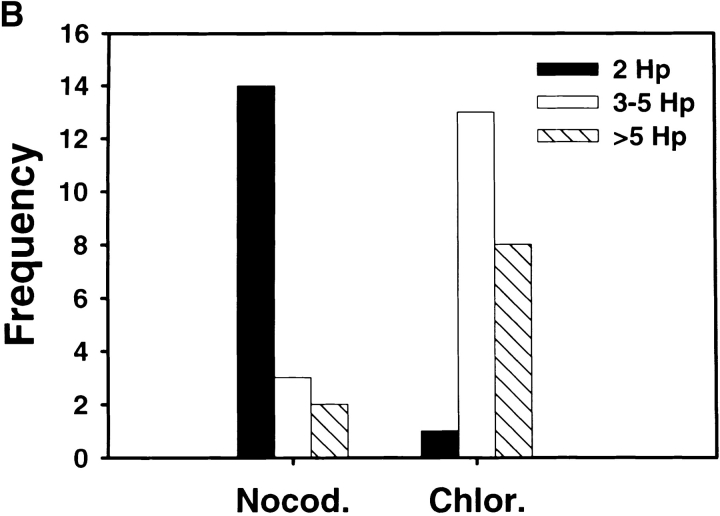
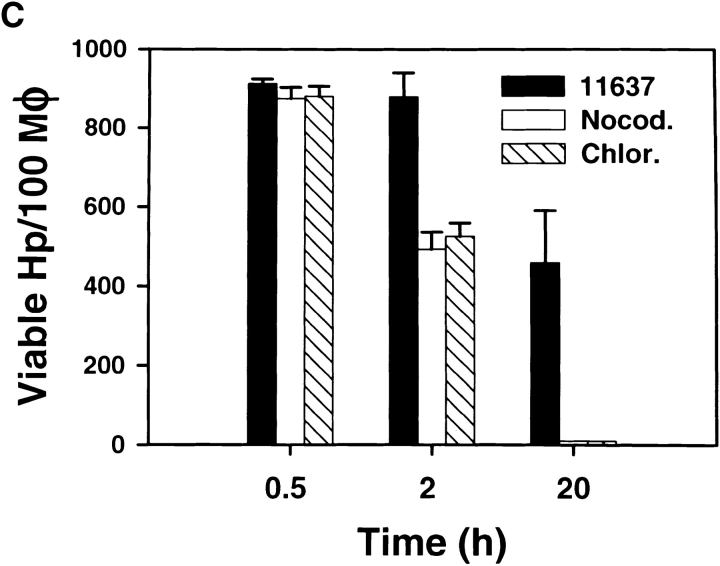
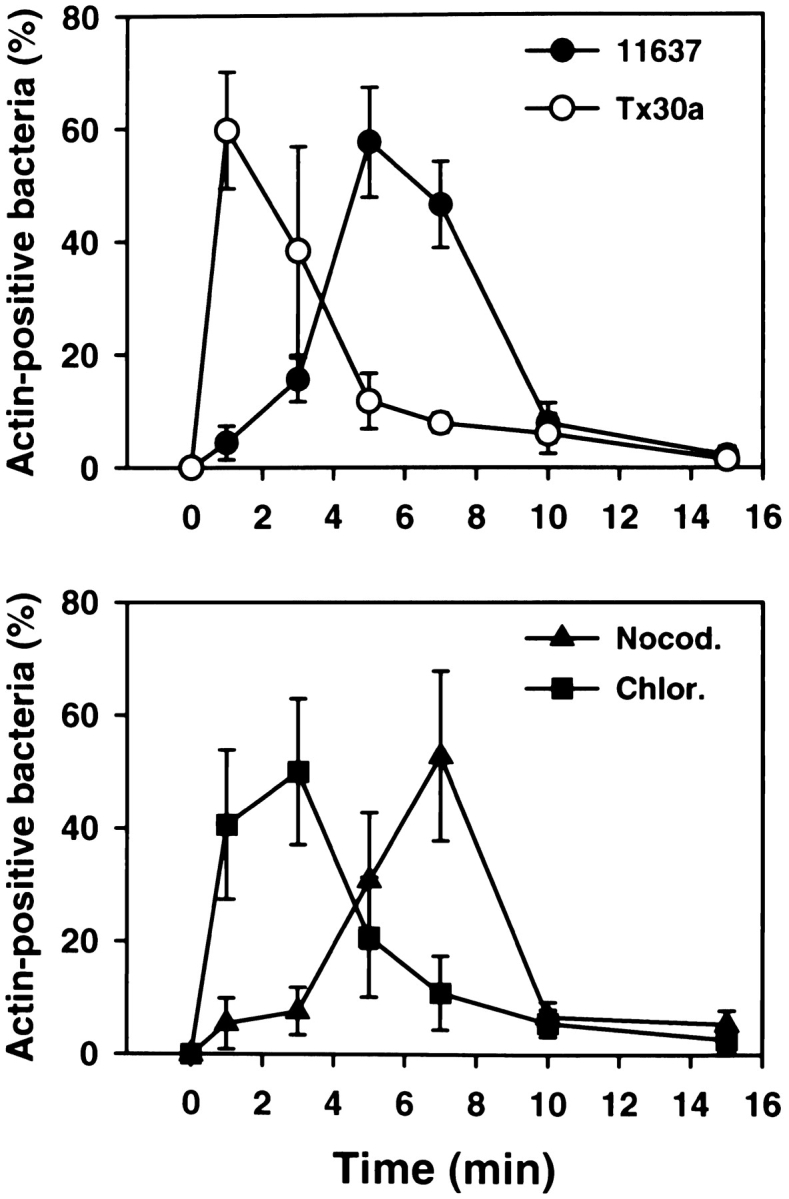
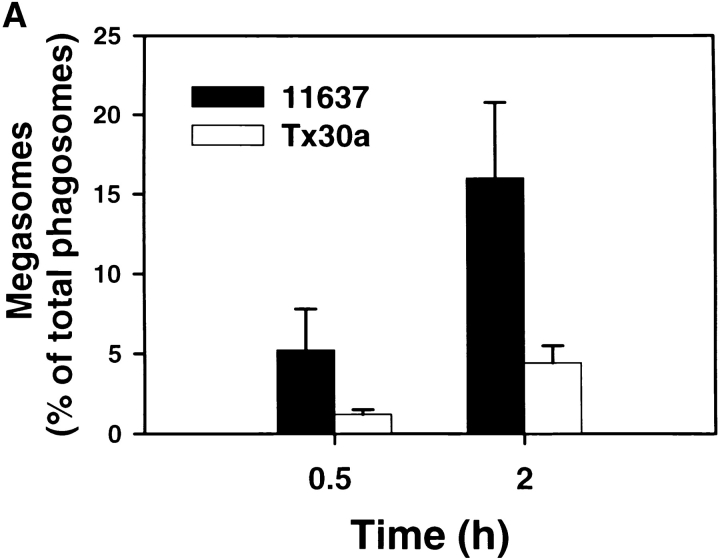
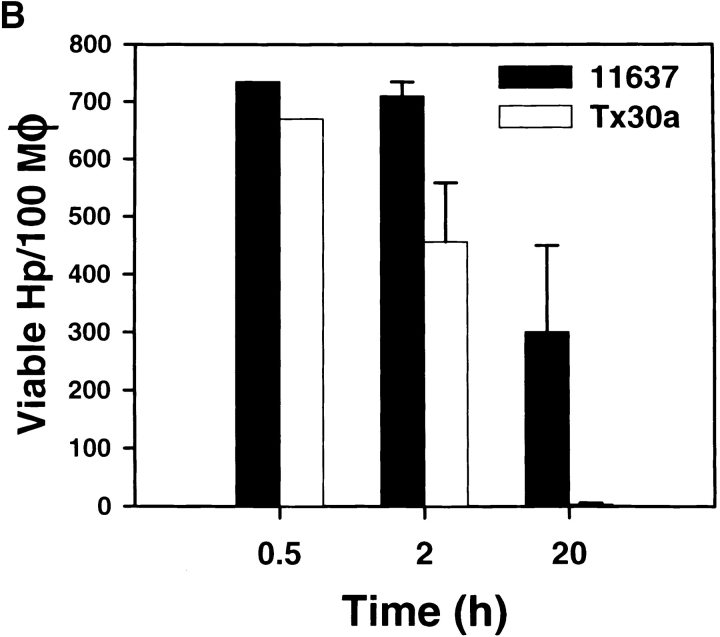
Helicobacter pylori colonizes the gastric epithelium of approximately 50% of the world's population and plays a causative role in the development of gastric and duodenal ulcers. H. pylori is phagocytosed by mononuclear phagocytes, but the internalized bacteria are not killed and the reasons for this host defense defect are unclear. We now show using immunofluorescence and electron microscopy that H. pylori employs an unusual mechanism to avoid phagocytic killing: delayed entry followed by homotypic phagosome fusion. Unopsonized type I H. pylori bound readily to macrophages and were internalized into actin-rich phagosomes after a lag of approximately 4 min. Although early (10 min) phagosomes contained single bacilli, H. pylori phagosomes coalesced over the next approximately 2 h. The resulting "megasomes" contained multiple viable organisms and were stable for 24 h. Phagosome-phagosome fusion required bacterial protein synthesis and intact host microtubules, and both chloramphenicol and nocodazole increased killing of intracellular H. pylori. Type II strains of H. pylori are less virulent and lack the cag pathogenicity island. In contrast to type I strains, type II H. pylori were rapidly ingested and killed by macrophages and did not stimulate megasome formation. Collectively, our data suggest that megasome formation is an important feature of H. pylori pathogenesis.


Figures

Figure 1
Figure 1
Phagocytic killing of Hp by murine macrophages is impaired. Peritoneal macrophages were incubated with Hp 11637 or Ye 8081c at a ratio of 1:25, and phagocytosis was synchronized using centrifugation. As indicated in Materials and Methods, bacterial viability before gentamicin treatment (15 min and 1 h) was determined by vital staining of permeabilized macrophages, whereas viability at later times (2–24 h) was determined by plating macrophage lysates for CFU. Data shown are the average ± SD of three independent experiments. Note that the y-axis is a log scale. Comparable data were obtained using Hp 60190 and J774 cells (not shown). Similar killing curves were generated using 5–100 bacteria per phagocyte (not shown). Mφ, macrophage.
Figure 2
Figure 2
Ingestion of Hp by macrophages is delayed relative to bacterial binding. Phagocytosis of Hp 11637 or Ye by peritoneal macrophages was synchronized using centrifugation. After incubation at 37°C for the indicated times, forming phagosomes were detected by staining fixed and permeabilized macrophages with FITC– or rhodamine–phalloidin, and cell-associated organisms were detected using phase contrast microscopy. (A) Representative forming phagosomes containing Hp or Ye. Left column, phase contrast; Right column, F-actin. Forming phagosomes containing Ye were abundant after 0.5 min at 37°C (arrows, bottom panels). Actin rearrangements were not detected beneath bound Hp after 2 min at 37°C (arrows, top panels); however, numerous Hp phagosomes were detected after 4 min at 37°C (arrows, center panels). (B) Kinetics of phagosome formation and bacterial ingestion. Adherent macrophages ingested Hp or Ye for 0–15 min at 37°C before processing for IFM. F-actin was detected as in A, and the results are expressed as the percentage of actin-positive cell-associated bacteria over time. The total number of cell-associated bacteria per 100 macrophages did not change significantly over the time course of the experiment: 800 ± 87 Hp and 771 ± 106 Ye at 1 min, and 882 ± 91 Hp and 800 ± 92 Ye at 15 min. Data shown are the average ± SD from three independent experiments conducted in triplicate. At least 300 bacteria were scored per sample per time. Comparable data were obtained using J774 cells or Hp 60190 (not shown).
Figure 2
Figure 2
Ingestion of Hp by macrophages is delayed relative to bacterial binding. Phagocytosis of Hp 11637 or Ye by peritoneal macrophages was synchronized using centrifugation. After incubation at 37°C for the indicated times, forming phagosomes were detected by staining fixed and permeabilized macrophages with FITC– or rhodamine–phalloidin, and cell-associated organisms were detected using phase contrast microscopy. (A) Representative forming phagosomes containing Hp or Ye. Left column, phase contrast; Right column, F-actin. Forming phagosomes containing Ye were abundant after 0.5 min at 37°C (arrows, bottom panels). Actin rearrangements were not detected beneath bound Hp after 2 min at 37°C (arrows, top panels); however, numerous Hp phagosomes were detected after 4 min at 37°C (arrows, center panels). (B) Kinetics of phagosome formation and bacterial ingestion. Adherent macrophages ingested Hp or Ye for 0–15 min at 37°C before processing for IFM. F-actin was detected as in A, and the results are expressed as the percentage of actin-positive cell-associated bacteria over time. The total number of cell-associated bacteria per 100 macrophages did not change significantly over the time course of the experiment: 800 ± 87 Hp and 771 ± 106 Ye at 1 min, and 882 ± 91 Hp and 800 ± 92 Ye at 15 min. Data shown are the average ± SD from three independent experiments conducted in triplicate. At least 300 bacteria were scored per sample per time. Comparable data were obtained using J774 cells or Hp 60190 (not shown).
Figure 3
Figure 3
Hp phagosomes rapidly coalesce inside macrophages. Phagocytosis of Hp by adherent macrophages was synchronized as described above. After 1–20 h at 37°C, samples were processed for IFM. (A) Top panels, appearance of Hp megasomes 1–20 h after initiation of phagocytosis of Hp 60190. Peritoneal macrophages, 1–2 h panels; J774 cells, 20 h panels. Fixed and permeabilized cells were stained with pAbs to Hp and secondary Abs conjugated to FITC or TRITC. Left panels, phase contrast; right panels, Hp phagosomes. Arrowheads, small/conventional phagosomes; arrows, Hp megasomes. Note that 2 h megasomes are larger than 1 h megasomes. Bottom panels: 6 h after ingestion of Hp 11637, live macrophages were permeabilized with saponin and stained with BacLight reagents. Hp emitted green fluorescence, demonstrating that these bacteria were viable inside megasomes (right panel, greyscale image of emitted green fluorescence; left panel, phase contrast). Arrows, Hp; N, macrophage nucleus. (B) Time course of megasome formation. Peritoneal macrophages (PM) or human MDMs ingested Hp 11637 or 60190 for the indicated times. Fixed-permeabilized cells were stained with Abs to Hp as described above. Phagosomes were scored as small/conventional or large/megasomes as described in Materials and Methods. The graph indicates the number of megasomes as a percentage of total Hp phagosomes. Data shown are the average ± SD of three independent experiments conducted in triplicate (PMs) or duplicate (MDMs). nd, not determined.
Figure 3
Figure 3
Hp phagosomes rapidly coalesce inside macrophages. Phagocytosis of Hp by adherent macrophages was synchronized as described above. After 1–20 h at 37°C, samples were processed for IFM. (A) Top panels, appearance of Hp megasomes 1–20 h after initiation of phagocytosis of Hp 60190. Peritoneal macrophages, 1–2 h panels; J774 cells, 20 h panels. Fixed and permeabilized cells were stained with pAbs to Hp and secondary Abs conjugated to FITC or TRITC. Left panels, phase contrast; right panels, Hp phagosomes. Arrowheads, small/conventional phagosomes; arrows, Hp megasomes. Note that 2 h megasomes are larger than 1 h megasomes. Bottom panels: 6 h after ingestion of Hp 11637, live macrophages were permeabilized with saponin and stained with BacLight reagents. Hp emitted green fluorescence, demonstrating that these bacteria were viable inside megasomes (right panel, greyscale image of emitted green fluorescence; left panel, phase contrast). Arrows, Hp; N, macrophage nucleus. (B) Time course of megasome formation. Peritoneal macrophages (PM) or human MDMs ingested Hp 11637 or 60190 for the indicated times. Fixed-permeabilized cells were stained with Abs to Hp as described above. Phagosomes were scored as small/conventional or large/megasomes as described in Materials and Methods. The graph indicates the number of megasomes as a percentage of total Hp phagosomes. Data shown are the average ± SD of three independent experiments conducted in triplicate (PMs) or duplicate (MDMs). nd, not determined.
Figure 5
Figure 5
Megasomes increase in size and number over time. Peritoneal macrophages (top panel) or J774 cells (bottom panel) ingested Hp 11637 for the indicated times before processing for TEM. To assess whether phagosome–phagosome fusion was progressive, both the total number of megasomes (Table ) and the number of bacteria per megasome (this figure) was scored in cell sections as described in Materials and Methods. “Frequency” indicates the number of megasomes containing 2 Hp (black bars), 3–5 Hp (white bars), or >5 Hp (hatched bars) at each time point. Phagosomes containing single Hp are not shown in this figure.
Figure 4
Figure 4
Ultrastructure of Hp phagosomes in macrophages. Peritoneal macrophages (A–D, G, H) or J774 cells (E and F) were infected with Hp 11637 (A–F) or Tx30a (G and H) at a ratio of 100 bacteria/macrophage. At various times after bacterial ingestion, samples were processed for TEM as described in Materials and Methods. (A) Ingestion of Hp. (B) 10 min phagosomes containing single bacteria. (C) 30 min megasome. (D and F) 24 h megasomes. (E) 6 h megasome in a J774 cell. Arrows in D and E indicate single phagosomes adjacent to megasomes. (G and H) 30 min phagosomes containing Tx30a. These type II Hp were found in conventional phagosomes (H, arrows), and some of the organisms appeared degraded (G, arrows). Arrowhead in G indicates a rare Tx30a phagosome that might contain two organisms. Magnifications: A and C, 20,000; B, 10,000; D, E, G, and H, 7,000; F, 12,000.
Figure 7
Figure 7
Nocodazole and chloramphenicol inhibit megasome formation and increase intracellular killing of Hp. Peritoneal macrophages and Hp were treated with 2 μg/ml nocodazole, 30–100 μg/ml chloramphenicol, or 100 μg/ml cycloheximide as described in Materials and Methods. Megasome formation and megasome size was scored using LM and TEM. Phagocytic killing was assayed as described above. (A) Nocodazole and chloramphenicol inhibit megasome formation. Macrophages and Hp were treated with nocodazole (Nocod.), chloramphenicol (Clr.), or cycloheximide (Chx.) as indicated, and samples were fixed-processed for LM and TEM 2 h after initiation of phagocytosis. The graphs show the number of megasomes as a percentage of all Hp phagosomes. Top panel: megasomes were scored in fixed and permeabilized cells using LM. Data shown are the average ± SD of three to six independent experiments performed in triplicate. Bottom panel, effect of 100 μg/ml chloramphenicol and 2 μg/ml nocodazole on megasome formation as judged by TEM. Con., control. (B) Effect of 2 μg/ml nocodazole and 100 μg/ml chloramphenicol on megasome size. Macrophages were fixed and processed for TEM 2 h after initiation of phagocytosis. “Frequency” indicates the number of megasomes containing 2 Hp (black bars), 3–5 Hp (white bars), or >5 Hp (hatched bars). The size of 2 h megasomes in control macrophages is shown in Fig. 5. (C) Macrophages and Hp 11637 were left untreated or incubated with 2 μg/ml nocodazole or 100 μg/ml chloramphenicol, and phagocytic killing was measured after 0.5–20 h. Data shown are the average ± SD of four independent experiments.
Figure 7
Figure 7
Nocodazole and chloramphenicol inhibit megasome formation and increase intracellular killing of Hp. Peritoneal macrophages and Hp were treated with 2 μg/ml nocodazole, 30–100 μg/ml chloramphenicol, or 100 μg/ml cycloheximide as described in Materials and Methods. Megasome formation and megasome size was scored using LM and TEM. Phagocytic killing was assayed as described above. (A) Nocodazole and chloramphenicol inhibit megasome formation. Macrophages and Hp were treated with nocodazole (Nocod.), chloramphenicol (Clr.), or cycloheximide (Chx.) as indicated, and samples were fixed-processed for LM and TEM 2 h after initiation of phagocytosis. The graphs show the number of megasomes as a percentage of all Hp phagosomes. Top panel: megasomes were scored in fixed and permeabilized cells using LM. Data shown are the average ± SD of three to six independent experiments performed in triplicate. Bottom panel, effect of 100 μg/ml chloramphenicol and 2 μg/ml nocodazole on megasome formation as judged by TEM. Con., control. (B) Effect of 2 μg/ml nocodazole and 100 μg/ml chloramphenicol on megasome size. Macrophages were fixed and processed for TEM 2 h after initiation of phagocytosis. “Frequency” indicates the number of megasomes containing 2 Hp (black bars), 3–5 Hp (white bars), or >5 Hp (hatched bars). The size of 2 h megasomes in control macrophages is shown in Fig. 5. (C) Macrophages and Hp 11637 were left untreated or incubated with 2 μg/ml nocodazole or 100 μg/ml chloramphenicol, and phagocytic killing was measured after 0.5–20 h. Data shown are the average ± SD of four independent experiments.
Figure 6
Figure 6
Kinetics of phagocytosis of Hp 11637 and Tx30a. Top panel: peritoneal macrophages were infected with Hp 11637 or Tx30a, and the kinetics of phagocytosis were followed in fixed and permeabilized cells double-stained with Abs to Hp and FITC–phalloidin. Results are expressed as described for Fig. 2 B. In contrast to the wild-type strain, phagocytosis of Tx30a was not significantly delayed relative to bacterial binding. Data shown are the average ± SD of three (11637) or five (Tx30a) independent experiments conducted in triplicate. Bottom panel: effect of nocodazole (Nocod.) and chloramphenicol (Chlor.) on the rate of phagocytosis of Hp 11637. Phagocytosis assays were performed in the presence of 2 μg/ml nocodazole or 100 μg/ml chloramphenicol as described above. Inhibition of bacterial protein synthesis, but not depolymerization of MTs, increased the rate of phagocytosis of Hp 11637. Data shown are the average ± SD of two (nocodazole) or four (chloramphenicol) independent experiments run in triplicate.
Figure 8
Figure 8
Tx30a does not induce megasome formation and is efficiently killed. Peritoneal macrophages were infected with Hp 11637 or Tx30a as described above. (A) After 0.5 or 2 h of phagocytosis at 37°C, fixed and permeabilized cells were stained with pAb to Hp and secondary Abs conjugated to TRITC. Megasome formation was scored using immunofluorescence and phase contrast microscopy. The graph indicates the number of megasomes as a percentage of total Hp phagosomes. Data shown are the average ± SD of three independent experiments conducted in triplicate. (B) Phagocytic killing of Tx30a and 11637 was determined as described for Fig. 1. Initial average phagocytic indices were 735 ± 20 and 670 ± 26 for 11637 and Tx30a, respectively. 20 h after initiation of phagocytosis, 99.5 ± 0.4% of ingested Tx30a were killed. Data shown are the average ± SD of four independent experiments. Similar data were obtained using J774 cells (data not shown).
Figure 8
Figure 8
Tx30a does not induce megasome formation and is efficiently killed. Peritoneal macrophages were infected with Hp 11637 or Tx30a as described above. (A) After 0.5 or 2 h of phagocytosis at 37°C, fixed and permeabilized cells were stained with pAb to Hp and secondary Abs conjugated to TRITC. Megasome formation was scored using immunofluorescence and phase contrast microscopy. The graph indicates the number of megasomes as a percentage of total Hp phagosomes. Data shown are the average ± SD of three independent experiments conducted in triplicate. (B) Phagocytic killing of Tx30a and 11637 was determined as described for Fig. 1. Initial average phagocytic indices were 735 ± 20 and 670 ± 26 for 11637 and Tx30a, respectively. 20 h after initiation of phagocytosis, 99.5 ± 0.4% of ingested Tx30a were killed. Data shown are the average ± SD of four independent experiments. Similar data were obtained using J774 cells (data not shown).

References

    1. Blaser M.J., Parsonnet J. Parasitism by the “slow” bacterium Helicobacter pylori leads to altered gastric homeostasis and neoplasia. J. Clin. Invest. 1994;94:4–8 . - PMC - PubMed
    1. Czinn S.J., Nedrud J.G. Immunopathology of Helicobacter pylori infection and disease. Springer Semin. Immunopathol. 1997;18:495–513 . - PubMed
    1. Blaser M.J. Helicobacter pylorimicrobiology of a ‘slow’ bacterial infection. Trends Microbiol. 1993;1:255–260 . - PubMed
    1. Telford J.L., Covacci A., Rappuoli R., Ghiara P. Immunobiology of Helicobacter pylori infection. Curr. Opin. Immunol. 1997;9:498–503 . - PubMed
    1. Xiang Z., Censini S., Bayeli P.F., Telford J.L., Figura N., Rappuoli R., Covacci A. Analysis of expression of CagA and VacA virulence factors in 43 strains of Helicobacter pylori reveals that clinical isolates can be divided into two major types and that CagA is not necessary for expression of the vacuolating cytotoxin. Infect. Immun. 1995;63:94–98 . - PMC - PubMed

Publication types

Substances