. 2000 Jan 3;191(1):157-70.
doi: 10.1084/jem.191.1.157.

Differential roles of interleukin 15 mRNA isoforms generated by alternative splicing in immune responses in vivo

Affiliations

Differential roles of interleukin 15 mRNA isoforms generated by alternative splicing in immune responses in vivo

H Nishimura et al. J Exp Med. .

Abstract

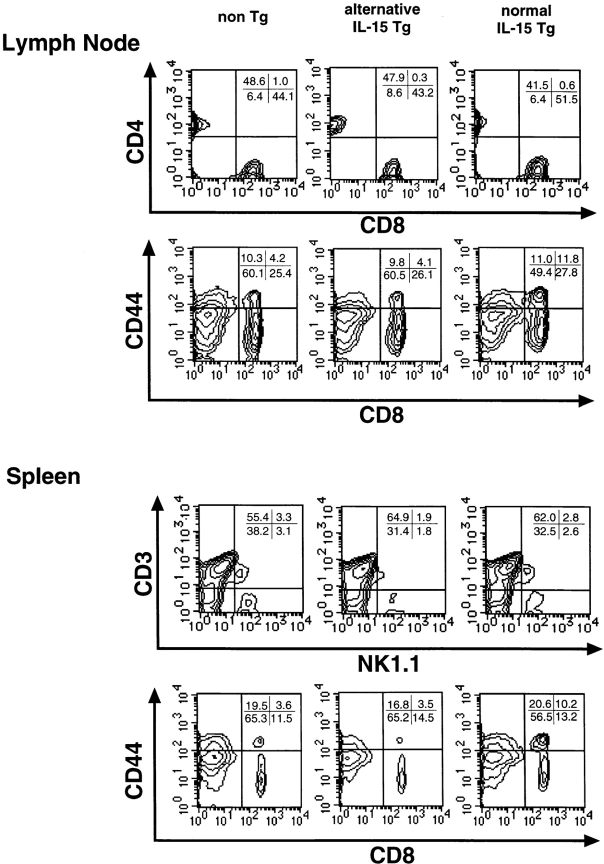
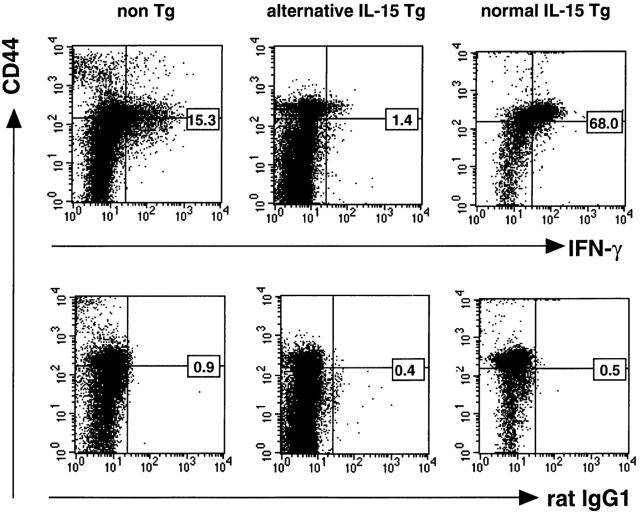
At least two types of interleukin (IL)-15 mRNA isoforms are generated by alternative splicing at the 5' upstream of exon 5 in mice. To elucidate the potential roles of IL-15 isoforms in immune responses in vivo, we constructed two groups of transgenic mice using originally described IL-15 cDNA with a normal exon 5 (normal IL-15 transgenic [Tg] mice) and IL-15 cDNA with an alternative exon 5 (alternative IL-15 Tg mice) under the control of an MHC class I promoter. Normal IL-15 Tg mice constitutionally produced a significant level of IL-15 protein and had markedly increased numbers of memory type (CD44(high) Ly6C(+)) of CD8(+) T cells in the LN. These mice showed resistance to Salmonella infection accompanied by the enhanced interferon (IFN)-gamma production, but depletion of CD8(+) T cells exaggerated the bacterial growth, suggesting that the IL-15-dependent CD8(+) T cells with a memory phenotype may serve to protect against Salmonella infection in normal IL-15 Tg mice. On the other hand, a large amount of intracellular IL-15 protein was detected but hardly secreted extracellularly in alternative IL-15 Tg mice. Although most of the T cells developed normally in the alternative IL-15 Tg mice, they showed impaired IFN-gamma production upon TCR engagement. The alternative IL-15 transgenic mice were susceptible to Salmonella accompanied by impaired production of endogenous IL-15 and IFN-gamma. Thus, two groups of IL-15 Tg mice may provide information concerning the different roles of IL-15 isoforms in the immune system in vivo.


Figures

Figure 3
Figure 3
Flow cytometry analysis of the peripheral T cell subsets in IL-15 Tg mice. Lymphocytes were prepared from the LN or the spleen of normal IL-15 Tg mice, alternative IL-15 Tg mice, and control C57BL/6 mice as described in Materials and Methods. The cells from the LN were stained with FITC-CD3, PE-CD8α, and Cy-Chrome-CD4, and then the cells were analyzed by a flow cytometer and the analysis gate was set on CD3+ cells. The cells were also stained FITC-CD44 and PE-CD8α. Cells from the spleen were stained with FITC-CD3∈ and PE-NK1.1 or FITC-CD44 and PE-CD8α, and then they were analyzed by a flow cytometer. Data are representative of three independent experiments using pooled cells from three mice and are shown as typical two-color profiles.
Figure 1
Figure 1
Schematic illustration of the organization of the mouse IL-15 gene and IL-15 transgenes. Exons 1–8 are shown as open boxes and introns as disconnected lines in the mouse IL-15 gene organization above the schematic representation of the transgene construct. φ denotes an alternatively spliced additional sequence of exon 5. The H-2K promoter, β-globin splice site + poly A signal, and Ig enhancer are shown in the transgenic vector. Coding regions are indicated by black boxes and noncoding region by stippled boxes.
Figure 2
Figure 2
Expression of the transgenes in the IL-15 Tg mice. (A) Quantitative RT-PCR analysis of IL-15 Tg mice (left). mRNA from macrophages of normal IL-15 Tg mice, alternative IL-15 Tg mice, and control C57BL/6 mice was transcribed into cDNA and amplified by PCR using common primers for exons 6–7, and 8. cDNA were adjusted to identical concentrations of β-actin cDNA by coamplification of constant amounts of cDNA and twofold dilutions of mimic. Identical amounts of cDNA were used for PCR with IL-15–specific primer in the presence of twofold dilution of mimic. Arrows indicate the titration point when equal band intensities were obtained for target cDNA and mimic. Southern blot analysis of RT-PCR products amplified with primers for exons 1 and 8 (right). The cDNA was amplified by PCR using primers for exons 1 and 8. The PCR products were hybridized with an internal probe specific for exon 7 or additional sequence φ. (B) Production of IL-15 protein in the serum of IL-15 Tg mice. The serum was collected from normal IL-15 Tg mice, alternative IL-15 Tg mice, and control C57BL/6 mice noninfected or i.p. infected with Salmonella choleraesuis (2 × 10⁶ CFU) on day 6, and the IL-15 protein levels were determined by mouse IL-15 ELISA. The production level of IL-15 protein was expressed as net OD absorbance at 450 nm. The IL-15 level at the line in the figure was shown as the amount of the detection limit. Data were obtained from three independent experiments and expressed as the means of triplicate determinations ± SD. (C) Intracellular IL-15 expression in IL-15 Tg mice. Macrophages from the peritoneum of normal IL-15 Tg mice (a), alternative IL-15 Tg mice (b), and control C57BL/6 mice (c) were stained with anti–mouse IL-15 antibody as described in Materials and Methods. The data are representative of three independent experiments, and typical confocal microscopic images are shown.
Figure 2
Figure 2
Expression of the transgenes in the IL-15 Tg mice. (A) Quantitative RT-PCR analysis of IL-15 Tg mice (left). mRNA from macrophages of normal IL-15 Tg mice, alternative IL-15 Tg mice, and control C57BL/6 mice was transcribed into cDNA and amplified by PCR using common primers for exons 6–7, and 8. cDNA were adjusted to identical concentrations of β-actin cDNA by coamplification of constant amounts of cDNA and twofold dilutions of mimic. Identical amounts of cDNA were used for PCR with IL-15–specific primer in the presence of twofold dilution of mimic. Arrows indicate the titration point when equal band intensities were obtained for target cDNA and mimic. Southern blot analysis of RT-PCR products amplified with primers for exons 1 and 8 (right). The cDNA was amplified by PCR using primers for exons 1 and 8. The PCR products were hybridized with an internal probe specific for exon 7 or additional sequence φ. (B) Production of IL-15 protein in the serum of IL-15 Tg mice. The serum was collected from normal IL-15 Tg mice, alternative IL-15 Tg mice, and control C57BL/6 mice noninfected or i.p. infected with Salmonella choleraesuis (2 × 10⁶ CFU) on day 6, and the IL-15 protein levels were determined by mouse IL-15 ELISA. The production level of IL-15 protein was expressed as net OD absorbance at 450 nm. The IL-15 level at the line in the figure was shown as the amount of the detection limit. Data were obtained from three independent experiments and expressed as the means of triplicate determinations ± SD. (C) Intracellular IL-15 expression in IL-15 Tg mice. Macrophages from the peritoneum of normal IL-15 Tg mice (a), alternative IL-15 Tg mice (b), and control C57BL/6 mice (c) were stained with anti–mouse IL-15 antibody as described in Materials and Methods. The data are representative of three independent experiments, and typical confocal microscopic images are shown.
Figure 5
Figure 5
Bystander activation of CD44+CD8+ T cells in IL-15 Tg mice. (A) Flow cytometry analysis of LN cells from normal IL-15 Tg mice or control C57BL/6 mice after culture with rIL-2 or rIL-15 was performed. The LN cells were cultured with or without rIL-2 (100 ng/ml) or rIL-15 (100 ng/ml) for 48 h at 37°C. After the culture, the cells were stained with PE-CD8α and FITC-CD44 mAb, and they were then analyzed by a flow cytometer. Blastoid cells were gated in FSC and SSC profiles as R1. CD44 expression on the responding cells, as evidenced by their blastoid appearance to rIL-15 or rIL-2, was presented as typical two-dimensional profiles. (B) Cytokine production of the LN cells in response to rIL-2 or IL-15 in IL-15 Tg mice was assessed by ELISA. The culture supernatant of A was collected and the IFN-γ activity was determined. The data are representative of two separate experiments and are expressed as the mean of triplicates ± SD.
Figure 5
Figure 5
Bystander activation of CD44+CD8+ T cells in IL-15 Tg mice. (A) Flow cytometry analysis of LN cells from normal IL-15 Tg mice or control C57BL/6 mice after culture with rIL-2 or rIL-15 was performed. The LN cells were cultured with or without rIL-2 (100 ng/ml) or rIL-15 (100 ng/ml) for 48 h at 37°C. After the culture, the cells were stained with PE-CD8α and FITC-CD44 mAb, and they were then analyzed by a flow cytometer. Blastoid cells were gated in FSC and SSC profiles as R1. CD44 expression on the responding cells, as evidenced by their blastoid appearance to rIL-15 or rIL-2, was presented as typical two-dimensional profiles. (B) Cytokine production of the LN cells in response to rIL-2 or IL-15 in IL-15 Tg mice was assessed by ELISA. The culture supernatant of A was collected and the IFN-γ activity was determined. The data are representative of two separate experiments and are expressed as the mean of triplicates ± SD.
Figure 4
Figure 4
Cell surface markers on CD44+CD8+ T cells in normal IL-15 Tg mice. (A) Expression of activation markers on the CD8+ T cells from the LN of normal IL-15 Tg mice was examined by a flow cytometer. The cells were stained with FITC-CD44, Biotin-CD8α, and PE-mAbs against various markers, and then they were analyzed by a flow cytometer, and the analysis gate was set on CD8+ cells. Data are representative of three independent experiments using pooled cells from three mice and are shown as typical two-color profiles. (B) Expression of IL-2 receptor subunits on CD8+ or CD4+ T cells from the LN of normal IL-15 Tg mice were examined. The cells were stained with PE-CD44, Cy-Chrome–CD4, or biotin-CD8α, and FITC-mAbs against IL-2 receptor subunits, and they were then analyzed by a flow cytometer, and the analysis gate was set on CD44+ or CD44 on CD4+ or CD8+ cells. Data are representative of three independent experiments using pooled cells from three mice and are shown as typical single-color profiles.
Figure 4
Figure 4
Cell surface markers on CD44+CD8+ T cells in normal IL-15 Tg mice. (A) Expression of activation markers on the CD8+ T cells from the LN of normal IL-15 Tg mice was examined by a flow cytometer. The cells were stained with FITC-CD44, Biotin-CD8α, and PE-mAbs against various markers, and then they were analyzed by a flow cytometer, and the analysis gate was set on CD8+ cells. Data are representative of three independent experiments using pooled cells from three mice and are shown as typical two-color profiles. (B) Expression of IL-2 receptor subunits on CD8+ or CD4+ T cells from the LN of normal IL-15 Tg mice were examined. The cells were stained with PE-CD44, Cy-Chrome–CD4, or biotin-CD8α, and FITC-mAbs against IL-2 receptor subunits, and they were then analyzed by a flow cytometer, and the analysis gate was set on CD44+ or CD44 on CD4+ or CD8+ cells. Data are representative of three independent experiments using pooled cells from three mice and are shown as typical single-color profiles.
Figure 6
Figure 6
IFN-γ production of LN cells in IL-15 Tg mice in response to TCR triggering. The LN cells from normal and alternative IL-15 Tg mice and control C57BL/6 were cultured in the presence (closed bars) or absence (open bars) of immobilized anti–TCR α/β mAb. At 24, 48, or 72 h after incubation, culture supernatants were harvested, and IFN-γ was measured by ELISA. The proliferation activity was assessed by incorporation of 3H-thymidine. The data are representative of three independent experiments using pooled cells from three transgenic mice or control mice and are shown as the mean of triplicate determinations ± SD.
Figure 8
Figure 8
Susceptibility to Salmonella infection in IL-15 transgenic mice. (A) Bacterial growth of S. choleraesuis in the peritoneal cavity after an i.p. challenge with S. choleraesuis. Mice were injected intraperitoneally with 2 × 10⁶ CFU. The number of bacteria was determined by a colony formation assay in tripto-soya agar plates. Data were obtained from three separate experiments and are expressed as the mean ± SD for nine mice at each point. Statistically significant differences between Tg mice and control mice are shown (*P < 0.05, **P < 0.001). (B) IFN-γ production in the serum of IL-15 transgenic mice after infection with S. choleraesuis. Serum was collected from normal or alternative IL-15 Tg mice or control mice after an intraperitoneal challenge with S. choleraesuis. The amount of IFN-γ in the serum was determined by ELISA. Data were obtained from three separate experiments and are expressed as the mean ± SD for nine mice at each point. Statistically significant differences between transgenic mice and control mice are shown (*P < 0.001).
Figure 8
Figure 8
Susceptibility to Salmonella infection in IL-15 transgenic mice. (A) Bacterial growth of S. choleraesuis in the peritoneal cavity after an i.p. challenge with S. choleraesuis. Mice were injected intraperitoneally with 2 × 10⁶ CFU. The number of bacteria was determined by a colony formation assay in tripto-soya agar plates. Data were obtained from three separate experiments and are expressed as the mean ± SD for nine mice at each point. Statistically significant differences between Tg mice and control mice are shown (*P < 0.05, **P < 0.001). (B) IFN-γ production in the serum of IL-15 transgenic mice after infection with S. choleraesuis. Serum was collected from normal or alternative IL-15 Tg mice or control mice after an intraperitoneal challenge with S. choleraesuis. The amount of IFN-γ in the serum was determined by ELISA. Data were obtained from three separate experiments and are expressed as the mean ± SD for nine mice at each point. Statistically significant differences between transgenic mice and control mice are shown (*P < 0.001).
Figure 7
Figure 7
Expression of IFN-γ in CD44+CD8+ T cells after an i.v. injection of anti–CD3 mAb. Normal or alternative IL-15 Tg mice or control C57BL/6 mice were injected intravenously with 4 μg of anti–CD3 mAb (145-2C 11). After 90 min, spleen cells were harvested and cultured for 3 h at 37°C in the presence of 10 μg/ml Brefeldin A. Intracellular cytokine-producing cells were examined by flow cytometry and analyzed by gating on CD8+ T cells. Data are representative of three independent experiments using pooled cells from three mice and are shown as typical two-color profiles.
Figure 9
Figure 9
Flow cytometry analysis of the peritoneal exudate cells in IL-15 Tg mice infected with S. choleraesuis on day 6. Nonadherent peritoneal exudate cells of normal and alternative IL-15 Tg mice and control C57BL/6 mice were stained with FITC-CD3, PE-CD8α, and Cychrom-CD4, and then the cells were analyzed by a flow cytometer and the analysis gate was set on CD3+ cells. The cells were also stained FITC-CD3∈ and PE-TCR-γ/δ or -NK1.1. Data are representative of three independent experiments using pooled cells from three mice and are shown as typical two-color profiles.
Figure 10
Figure 10
Generation of CD4 Th1 cells specific for Salmonella antigen in IL-15 Tg mice. CD4+ T cells (2 × 10⁵ cells) or CD8+ T cells (2 × 10⁵ cells) in LN of IL-15 Tg mice or control mice on day 6 after an i.p. challenge with S. choleraesuis (2 × 10⁶ CFU) were purified by MACS and cultured with or without heat-killed Salmonella in the presence of MMC-treated splenocytes (106 cells) for 3 d at 37°C. Thereafter, the supernatants were collected and cytokine activity was determined by ELISA. The data are representative of three independent experiments using pooled cells from five IL-15 Tg or control mice and shown as the mean of triplicate determinations ± SD. Statistical analysis was performed by means of Student's t test. Significant differences compared with the values in control mice are shown: *P < 0.01.
Figure 11
Figure 11
Effect of in vivo CD8 or CD4 depletion on Th1 response in normal IL-15 Tg mice. (A) Bacterial growth of S. choleraesuis in the spleen or the liver of CD8- or CD4-depleted normal IL-15 Tg mice on day 6 after an i.p. challenge with S. choleraesuis. Anti–CD8 mAb (400 μg, rat IgG2b, 2.43), anti–CD4 mAb (400 μg, rat IgG2b), or isotype control rat IgG was administered to normal IL-15 transgenic mice 2 d before an i.p. challenge with S. choleraesuis (2 × 10⁶ CFU). The number of bacteria was determined by colony formation assay in tripto-soya agar plates. Data are obtained from three separate experiments and are expressed as the mean ± SD for four mice at each point. Statistical analysis was performed by means of Student's t test. Significant differences compared with the values in control IgG-treated mice are shown: *P < 0.001. (B) CD4+ T cells (2 × 10⁵ cells) or CD8+ T cells (2 × 10⁵ cells) in LN of normal IL-15 Tg mice depleted CD8, CD4, or nondepleted on day 6 after an i.p. challenge with S. choleraesuis (2 × 10⁶ CFU) were purified by MACS and cultured with or without heat-killed Salmonella in the presence of MMC-treated splenocytes (106 cells) for 3 d at 37°C. Thereafter, the supernatants were collected, and cytokine activity was determined by ELISA. The data are representative of three independent experiments using pooled cells from five normal IL-15 Tg or control mice and shown as the mean of triplicate determinations ± SD. Statistical analysis was performed by means of Student's t test. Significant differences compared with the values in control-IgG treated mice are shown: *P < 0.01.

References

    1. Tagaya Y., Bamford R.N., DeFilippis A., Waldmann T.A. IL-15a pleiotropic cytokine with diverse receptor/signaling pathways whose expression is controlled at multiple levels. Immunity. 1996;4:329–336 . - PubMed
    1. Waldmann T.A., Tagaya Y., Bamford R.N. Interleukin-2, interleukin-15, and their receptors. Int. Rev. Immunol. 1998;16:205–226 . - PubMed
    1. Waldmann T.A., Tagaya Y. The multifaceted regulation of interleukin-15 expression and the role of this cytokine in NK cell differentiation and host response to intracellular pathogens. Annu. Rev. Immunol. 1999;17:19–49 . - PubMed
    1. Grabstein K.H., Eisenmann J., Shanebeck K., Rauch C., Srinivasan S., Fung V., Beers C., Richardson J., Schoenborn M.A., Ahdieh M. Cloning of a T-cell growth factor that interacts with the β chain of the interleukin-2 receptor. Science. 1994;246:965–968 . - PubMed
    1. Bamford R.N., Battiata A.P., Burton J.D., Sharma H., Waldmann T.A. IL-15/T production by the adult T-cell leukemia cell line HuT-102 is associated with an HTLV-I-R/IL-15 fusion message that lacks many upstream AUGs that normally attenuate IL-15 mRNA translation. Proc. Natl. Acad. Sci. USA. 1996;93:2897–2902 . - PMC - PubMed

Publication types

MeSH terms