Comparative Study
. 2000 Feb;74(3):1209-23.
doi: 10.1128/jvi.74.3.1209-1223.2000.

Normal T-cell turnover in sooty mangabeys harboring active simian immunodeficiency virus infection

Affiliations
Comparative Study

Normal T-cell turnover in sooty mangabeys harboring active simian immunodeficiency virus infection

L A Chakrabarti et al. J Virol. 2000 Feb.

Abstract

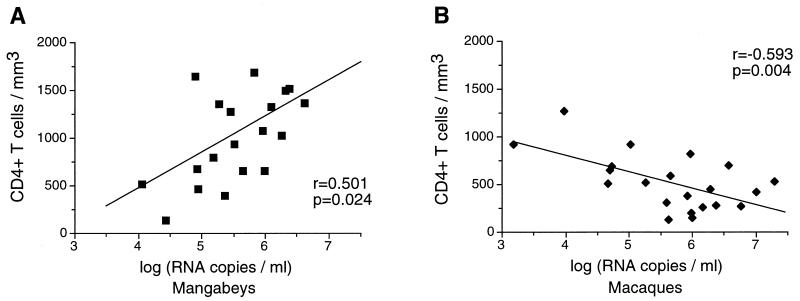
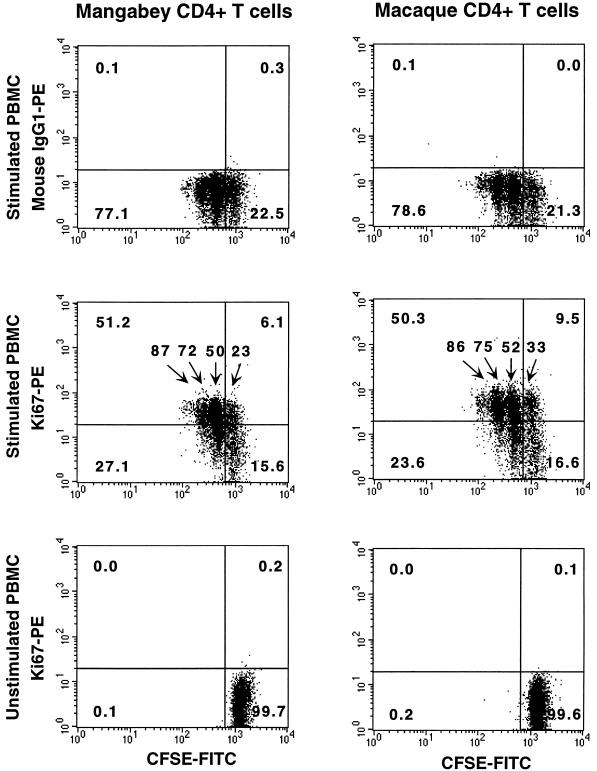
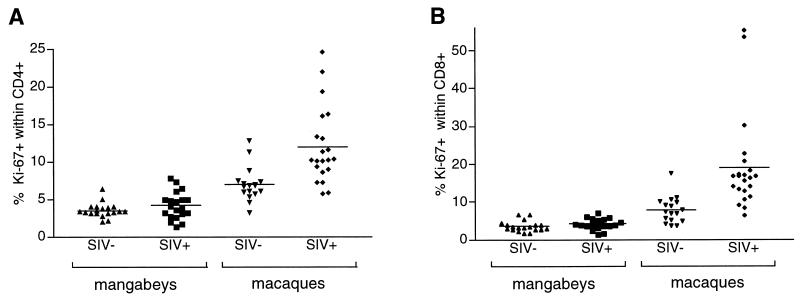
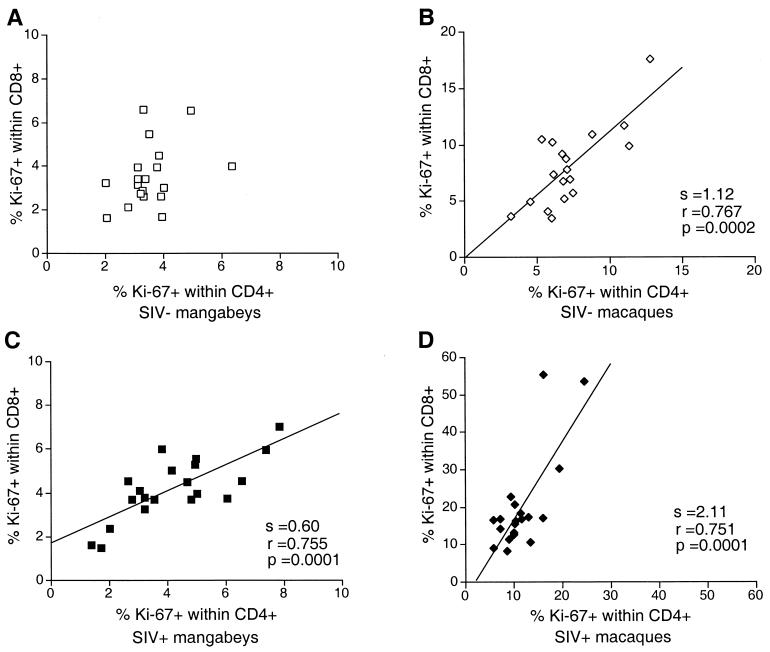
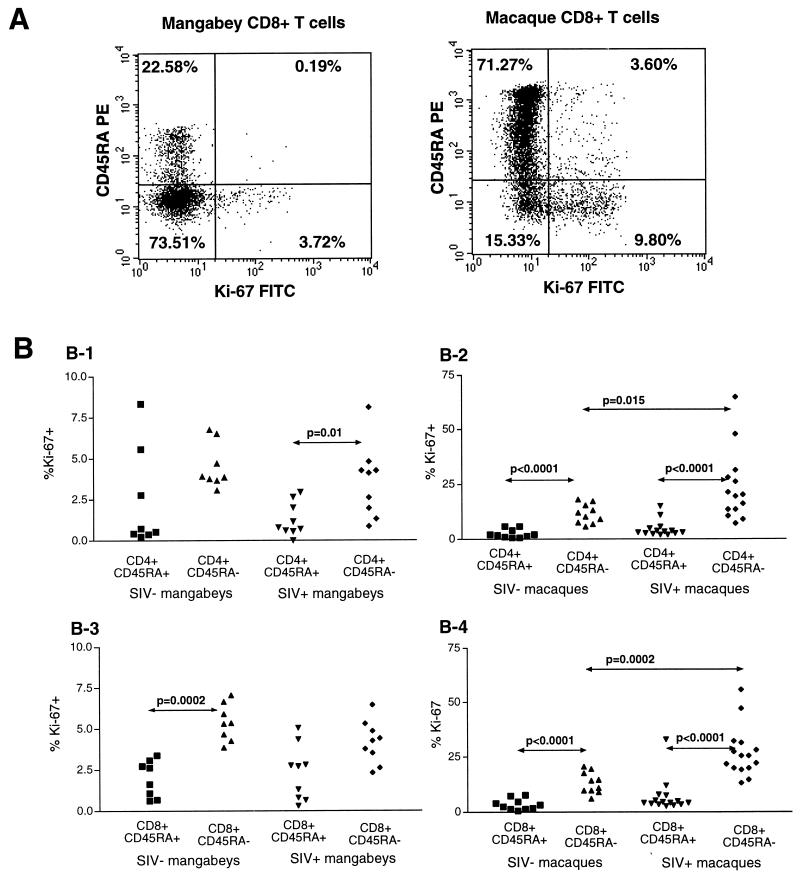
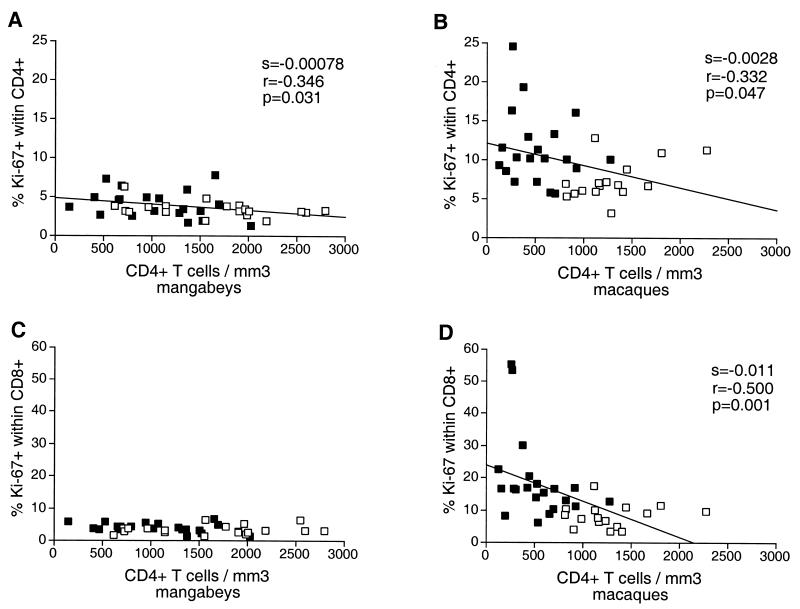
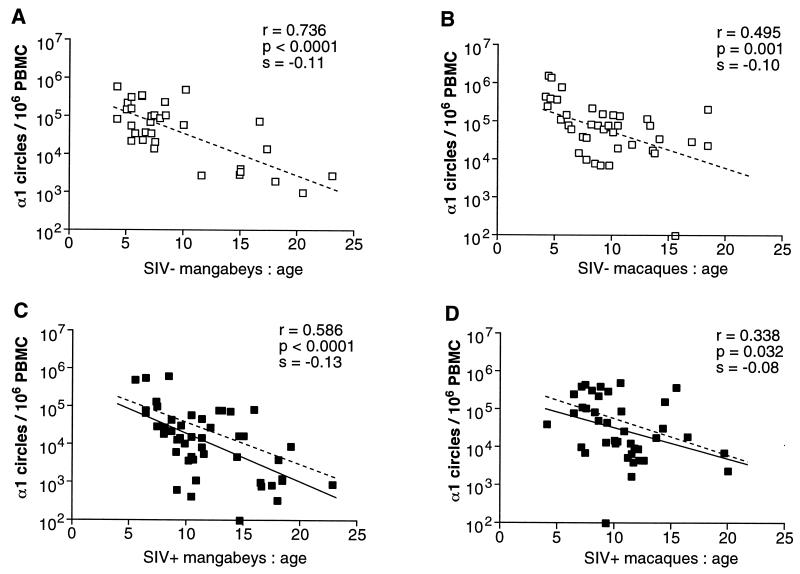
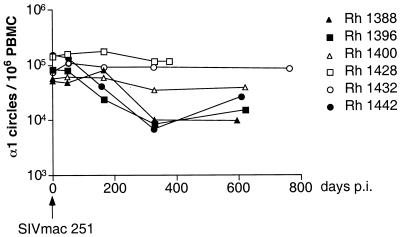
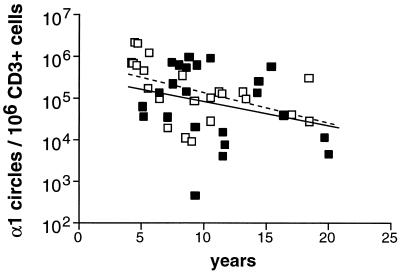
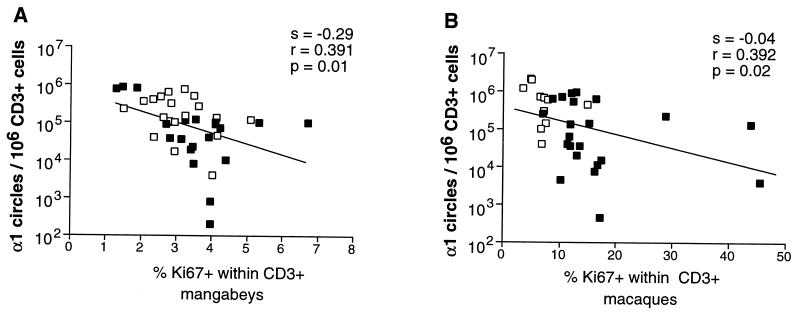
Sooty mangabeys naturally infected with simian immunodeficiency virus (SIV) remain healthy though they harbor viral loads comparable to those in rhesus macaques that progress to AIDS. To assess the immunologic basis of disease resistance in mangabeys, we compared the effect of SIV infection on T-cell regeneration in both monkey species. Measurement of the proliferation marker Ki-67 by flow cytometry showed that mangabeys harbored proliferating T cells at a level of 3 to 4% in peripheral blood irrespective of their infection status. In contrast, rhesus macaques demonstrated a naturally high fraction of proliferating T cells (7%) that increased two- to threefold following SIV infection. Ki-67(+) T cells were predominantly CD45RA(-), indicating increased proliferation of memory cells in macaques. Quantitation of an episomal DNA product of T-cell receptor alpha rearrangement (termed alpha1 circle) showed that the concentration of recent thymic emigrants in blood decreased with age over a 2-log unit range in both monkey species, consistent with age-related thymic involution. SIV infection caused a limited decrease of alpha1 circle numbers in mangabeys as well as in macaques. Dilution of alpha1 circles by T-cell proliferation likely contributed to this decrease, since alpha1 circle numbers and Ki-67(+) fractions correlated negatively. These findings are compatible with immune exhaustion mediated by abnormal T-cell proliferation, rather than with early thymic failure, in SIV-infected macaques. Normal T-cell turnover in SIV-infected mangabeys provides an explanation for the long-term maintenance of a functional immune system in these hosts.


Figures

FIG. 1
FIG. 1
Association between the plasma viral load and the concentration of peripheral CD4+ T cells. A positive correlation between the virus load and the CD4 T-cell number was observed in sooty mangabeys (A), while a negative correlation was observed in rhesus macaques (B). The viral load, which was measured with the SIV bDNA assay (Chiron Corporation), is expressed as the log of the equivalent number of viral RNA copies per milliliter of plasma.
FIG. 2
FIG. 2
Specific expression of Ki-67 in proliferating monkey CD4+ T cells. Macaque and mangabey PBMC were labeled with the dye CFSE, which allows tracking of successive generations of dividing cells. The amount of dye per cell decreases at each cell division, which allowed identification of each new generation by its decreased fluorescence intensity in the FL1 channel (x axis). The CFSE-stained cells were cultivated for 3 days in stimulated (top and middle panels) or unstimulated (bottom panels) conditions and were subsequently labeled with the Ki-67-PE antibody or the control antibody immunoglobulin G1 (IgG1)-PE (y axis). Ki-67 was preferentially expressed in cells that had divided after 3 days in culture, the Ki-67+ fraction being increasingly higher in cells that had undergone more divisions. The percentage of Ki-67+ cells among CD4+ T lymphocytes is reported above each generation. The numbers in the corners of the plots indicate the percentage of CD4+ T cells in each quadrant.
FIG. 3
FIG. 3
Percentage of Ki-67 expression in monkey CD4+ and CD8+ T cells. The percentage of Ki-67+ cells among the CD4+ T cells (A) and the CD8+ T cells (B) is plotted for each of the following four monkey populations: uninfected mangabeys (SIV−), SIV-positive mangabeys (SIV+), uninfected macaques (SIV−), and SIV-positive macaques (SIV+). The mean percentage of Ki-67+ T cells is indicated by a horizontal bar.
FIG. 4
FIG. 4
Positive correlation between the percentage of Ki-67+ cells within the CD4+ and CD8+ T-cell subsets. (A) Uninfected mangabeys; (B) uninfected macaques; (C) SIV-positive mangabeys; (D) SIV-positive macaques. The slope (s), the correlation coefficient (r), and the P value (p) associated with the regression lines are indicated. SIV−, SIV-negative; SIV+, SIV-positive.
FIG. 5
FIG. 5
Preferential expression of Ki-67 in the CD45RA subset of T lymphocytes. (A) Combined analysis of Ki-67 and CD45RA expression by flow cytometry. Dot plots showing the staining for Ki-67 (x axis) and CD45RA (y axis) in the CD3+ CD8+ T-cell population of two representative animals. Ki-67 is expressed preferentially in the CD45RA memory T-cell subset, both in an infected mangabey (left panel) and in an infected macaque (right panel). The numbers in the corners of the plots indicate the percentage of CD3+ CD8+ T cells in each quadrant. (B) Percentage of Ki-67+ cells within CD45RA+ and CD45RA T-cell subsets. Graphs show results for four types of cells, as follows: B-1, mangabey CD4+ T cells; B-2, macaque CD4+ T cells; B-3, mangabey CD8+ T cells; B-4, macaque CD8+ T cells. Only the P values lower than 0.05 in the nonparametric Mann-Whitney test are reported. SIV−, SIV-negative; SIV+, SIV-positive.
FIG. 6
FIG. 6
Association between the CD4+ T-cell concentration and the expression of Ki-67 in T cells. A negative correlation between the CD4+ T-cell count and the percentage of Ki67+ CD4+ T cells was observed in mangabeys (A) as well as in macaques (B). The absolute value of the slope is higher for macaques (28 × 10−4) than for mangabeys (7.8 × 10⁻⁴), underscoring the more active T-cell renewal process in the former species. A negative correlation between the percentage of Ki67+ CD8+ T cells and the CD4+ T cell count is observed in macaques (D) but not in mangabeys (C). Open squares, uninfected animals; solid squares, SIV-infected animals. The slope (s), the correlation coefficient (r), and the P value (p) associated with the regression lines are indicated.
FIG. 7
FIG. 7
Age-dependent decline of α1 circle numbers in PBMC. (A) Uninfected mangabeys; (B) uninfected macaques; (C) SIV-infected mangabeys; (D) SIV-infected macaques. The correlation coefficient (r), the P value (p), and the slope (s) associated with the regression lines are indicated. The regression lines in panels A and B (dashed line) were reported in panels C and D, respectively, to allow the comparison of α1 circle numbers between infected and uninfected animals. SIV−, SIV-negative; SIV+, SIV-positive.
FIG. 8
FIG. 8
Longitudinal analysis of α1 circle numbers in six infected macaques. The concentration of α1 circles in PBMC was measured over a 2-year period following SIVmac251 inoculation. p.i., postinoculation.
FIG. 9
FIG. 9
α1 circle numbers expressed in macaques. The number of α1 circles per million CD3+ T cells is reported as a function of the age of the animals (in years). Solid squares, SIV-positive macaques; open squares, uninfected macaques. The dashed line and the solid line correspond to regression lines obtained for uninfected and infected macaques, respectively. The slope of the regression line was s = −0.073 for uninfected macaques (P = 0.02). The slope did not significantly differ from 0 for SIV-positive macaques.
FIG. 10
FIG. 10
Inverse correlation between α1 circle numbers and T-cell proliferation rates. (A) Mangabeys; (B) macaques. The slope (s), correlation coefficient (r), and the P value (p) associated with the regression lines are indicated. Solid squares, SIV-positive animals; open squares, uninfected animals.

References

    1. Amedee A M, Lacour N, Gierman J L, Martin L N, Clements J E, Bohm R, Jr, Harrison R M, Murphey-Corb M. Genotypic selection of simian immunodeficiency virus in macaque infants infected transplacentally. J Virol. 1995;69:7982–7990. - PMC - PubMed
    1. Ameisen J C, Capron A. Cell dysfunction and depletion in AIDS: the programmed cell death hypothesis. Immunol Today. 1991;12:102–105. - PubMed
    1. Baskin G, Murphey-Corb M, Martin L, Davison-Fairburn B, Hu F-S, Kuebler D. Thymus in simian immunodeficiency virus-infected rhesus monkeys. Lab Investig. 1991;65:400–407. - PubMed
    1. Baskin G B, Murphey-Corb M, Watson E A, Martin L N. Necropsy findings in rhesus monkeys experimentally infected with cultured simian immunodeficiency virus (SIV)/delta. Vet Pathol. 1988;25:456–467. - PubMed
    1. Bell E B, Sparshott S M, Bunce C. CD4+ T-cell memory, CD45R subsets and the persistence of antigen—a unifying concept. Immunol Today. 1998;19:60–64. - PubMed

Publication types

MeSH terms

LinkOut - more resources