. 2000 Jan 1;20(1):283-93.
doi: 10.1523/JNEUROSCI.20-01-00283.2000.

The bHLH gene hes1 as a repressor of the neuronal commitment of CNS stem cells

Affiliations

The bHLH gene hes1 as a repressor of the neuronal commitment of CNS stem cells

Y Nakamura et al. J Neurosci. .

Abstract

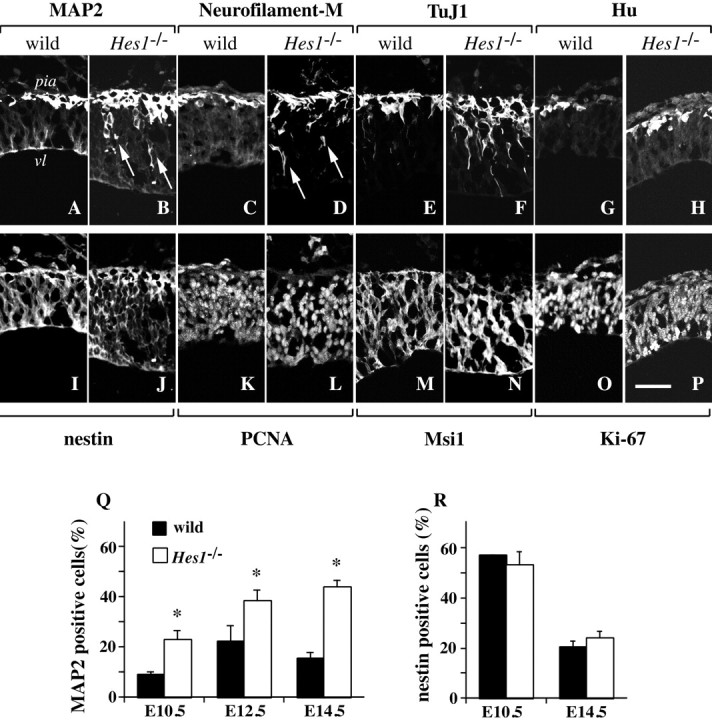
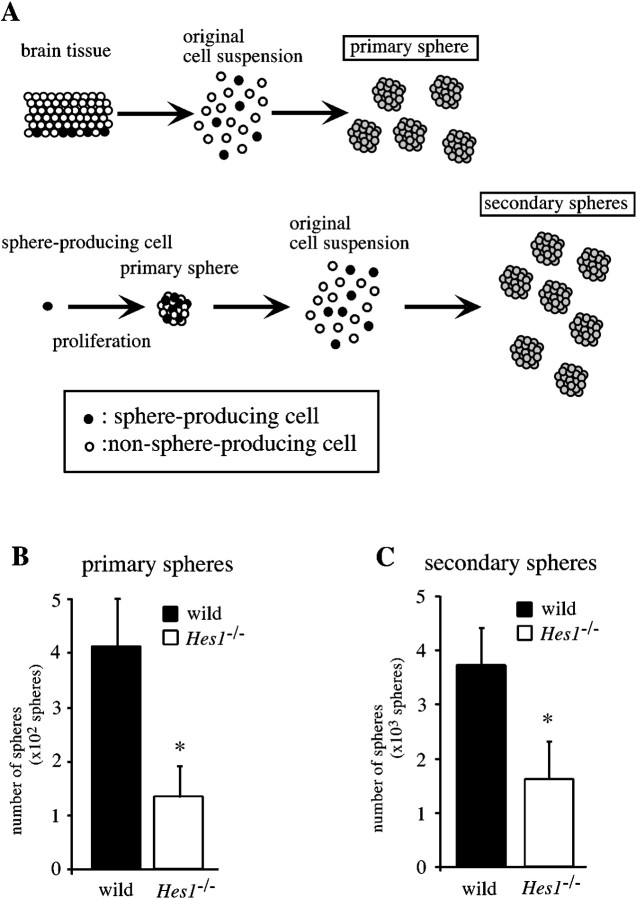
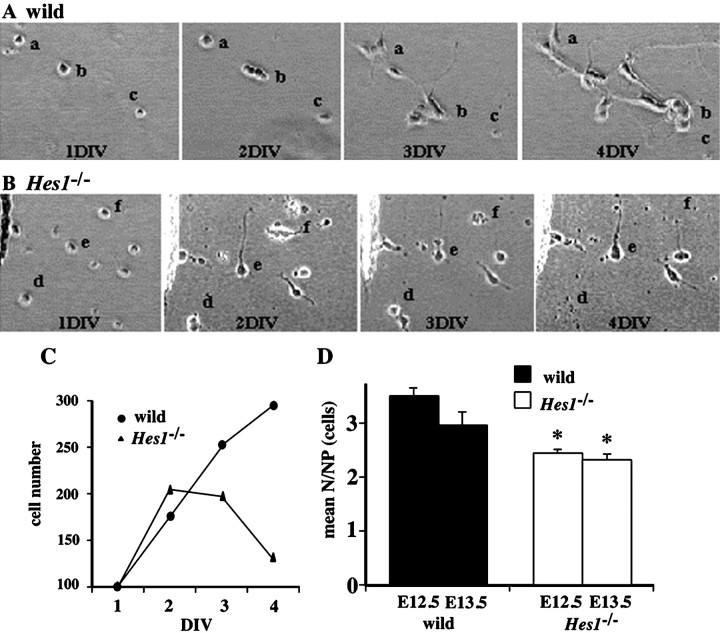
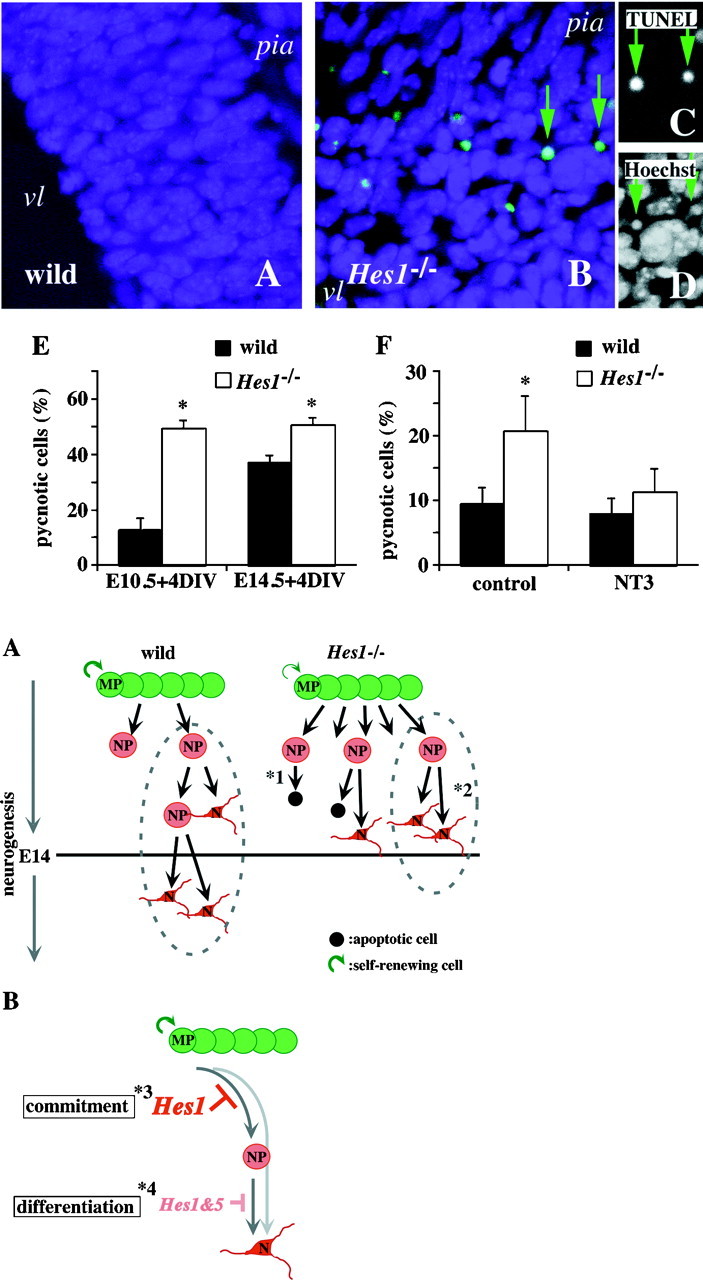
Hes1 is one of the basic helix-loop-helix transcription factors that regulate mammalian CNS development, and its loss- and gain-of-function phenotypes indicate that it negatively regulates neuronal differentiation. Here we report that Hes1(-/-) mice expressed both early (TuJ1 and Hu) and late (MAP2 and Neurofilament) neuronal markers prematurely, and that there were approximately twice the normal number of neurons in the Hes1(-/-) brain during early neural development. However, immunochemical analyses of sections and dissociated cells using neural progenitor markers, including nestin, failed to detect any changes in Hes1(-/-) progenitor population. Therefore, further characterization of neural progenitor cells that discriminated between multipotent and monopotent cells was performed using two culture methods, low-density culture, and a neurosphere assay. We demonstrate that the self-renewal activity of multipotent progenitor cells was reduced in the Hes1(-/-) brain, and that their subsequent commitment to the neuronal lineage was accelerated. The Hes1(-/-) neuronal progenitor cells were functionally abnormal, in that they divided, on average, only once, and then generated two neurons, (instead of one progenitor cell and one neuron), whereas wild-type progenitor cells divided more. In addition, some Hes1(-/-) progenitors followed an apoptotic fate. The overproduction of neurons in the early Hes1(-/-) brains may reflect this premature and immediate generation of neurons as well as a net increase in the number of neuronal progenitor cells. Taken together, we conclude that Hes1 is important for maintaining the self-renewing ability of progenitors and for repressing the commitment of multipotent progenitor cells to a neuronal fate, which is critical for the correct number of neurons to be produced and for the establishment of normal neuronal function.


Figures

Fig. 1.
Fig. 1.
Neurons increase in theHes1−/− brain, without a detectable change in the number and distribution of neural progenitor cells.A–P, Immunohistochemical analyses of neurons and neural progenitor cells in the brain. Cryosections of wild-type andHes1−/− embryos at E10.5 were double-stained with neuronal markers (top row) and neural progenitor cell markers (bottom row): MAP2/RAT401 (A, I; B, J), neurofilament-M/PCNA (C, K; D, L), TuJ1/Msi1 (E, M; F, N), and Hu/Ki-67 (G, O; H, P). Panels aligned above and below show identical views of the lateral region of the mesencephalon. The top of each panel corresponds to the pial side. The genotype of the mouse is indicatedabove each pair of double-stained panels. vl, Ventricle; pia, pial side of the mesencephalon. Scale bar:P, 50 μm. The numbers of TuJ1+ or Hu+ newborn neurons, as well as MAP2+ or NF+ mature neurons were increased in the Hes1−/− brain compared with wild-type. However, the distribution of neural progenitor cells was not significantly changed by the Hes1 mutation. Furthermore, premature expression of late neuronal markers near the ventricle was observed in Hes1−/− mice (B, D, arrows). Q, R, Immunocytochemical analyses to quantify the fractions of MAP2+ neurons (Q) and nestin+ neural progenitor cells (R). Wild-type andHes1−/− brains were dissociated (embryonic stages are indicated below each bar) and stained for MAP2 or nestin, then the ratio of marker-positive cells to total cells was calculated and presented as the mean ± SEM(%). (*p < 0.01 in comparison to wild-type.) The fraction of Hes1−/− neurons was markedly increased, approximately twice that of wild-type, and continued to increase until a later stage (E14.5) (Q). In contrast, there was no statistical difference in the fraction of nestin+ neural progenitor cells between wild-type and Hes1−/− mice at any developmental stage (R).
Fig. 2.
Fig. 2.
Self-renewing capability of multipotent progenitor cells is lower in Hes1−/− mice (neurosphere formation assay). A, Schematic representation of the experimental approaches used to investigate the self-renewing capability of MPs. The number of neurospheres retrospectively indicates the number of sphere-producing cells in the original cell suspension. Because most spheres are clonally derived from self-renewing and multipotent progenitor cells, the number of primary spheres indicates the MP population in the brain, and that of the secondary spheres indicates the MP population in primary spheres. Considering that the primary spheres are the products of the proliferation of the sphere-producing cells, the number of secondary spheres is likely to represent the self-renewing capability of MPs. B, Telencephalic cells of E10.5 wild-type andHes1−/− brains were dissociated and plated at 1 × 10⁵ cells per well of a 6-well plate, and the resultant primary spheres in each well were counted. Note that the number of Hes1−/− primary spheres was smaller, revealing the decreased MP-population in theHes1−/− brain. C, These primary spheres were collected, dissociated, and replated at 500 cells per well of a 96-well plate. The number of resultant secondary spheres on each plate was counted (derived from the originally plated 500 × 96 = 4.8 × 10⁴ cells). The decreased number of secondary spheres represents the lowered self-renewal activity of Hes1−/− MPs. All data are presented as the mean ± SEM of three independent culture experiments. *p < 0.01 in comparison with the wild-type control.
Fig. 3.
Fig. 3.
The developmental profiles of neuronal progenitor cells was followed in low-density culture. A, B, The dissociated cells derived from E13.5 telencephalons of wild-type (A) and Hes1−/− mice (Hes1−/−, B), were clonally cultured, and phase-contrast photos of identical fields were obtained at 1, 2, 3, and 4 DIV. The letters a–f in each panel are placed beside the colony derived from the same single progenitor cell. For instance, in colony b in the wild-type culture (A), the single progenitor cell at 1 DIV underwent several cell divisions, and four cells were observed at 2 DIV. They extended their processes toward the neighboring colony a and appeared to form network-like connections by 3 DIV. This network of cells became better established, and cells showed a more differentiated neuronal morphology with long and branched processes by 4 DIV. These cells also appeared to keep dividing until 4 DIV. In contrast, in coloniesd and f in theHes1−/− culture (B), single progenitor cells divided once by 2 DIV, but the resulting cells soon fell into apoptosis (d at 4 DIV; f at 3 DIV). The Hes1−/− neuron ein (B) extended thick processes rapidly by 2 DIV, but network-like connections were not formed as in the case of the wild-type culture at 4 DIV. C, Proliferating profiles of neuronal progenitor cells. The number of cells that originated from 100 neuronal progenitor cells in the low-density culture are summarized at the indicated day below the line graph. In the wild-type culture, progenitor cells kept increasing in number during the observation period. In contrast, the initial proliferation of progenitor cells was not disturbed by the Hes1mutation, but the cells stopped proliferating after 2 DIV and decreased in number (by apoptosis) in the Hes1−/−culture. D, The average number of neurons derived from a single neuronal progenitor cell. Numbers of neurons are represented in each bar as the means ± SEM of ∼100 NPs of three independent experiments. *p < 0.05 in comparison with the wild-type control of the same stage. The embryonic stages of the mice are indicated below each bar. The mean N/NP was reduced inHes1−/− mice, irrespective of the developmental stage.
Fig. 4.
Fig. 4.
Accelerated apoptosis in theHes1−/− brain. Apoptotic cells of an E10.5 brain were stained by the TUNEL method (green; DTAF) in wild-type (wild, A) andHes1−/−(Hes1−/−; B–D) mice. Clustered apoptotic cells were observed near the ventricle (vl) in the Hes1−/− brain, whereas apoptotic cells were seldom detected in the wild-type brain. Two apoptotic cells (B, arrows) are also shown by TUNEL (C) and Hoechst staining (D), respectively. The TUNEL+ cells (C, arrows) were also pyknotic (D, arrows), suggesting they were apoptotic rather than necrotic. Blue, nuclear staining with Hoechst;pia, pial side of the telencephalon. E, The fraction of apoptotic cells in vitro. The ratios of pyknotic (apoptotic) cells to total cells were determined by examining stained nuclei and presented as the means ± SEM of at least three independent experiments. *p < 0.01 in comparison with wild-type. The developmental stages of the embryos used are indicatedbelow each bar. The apoptotic cells in the wild-type brain increased from E10.5 + 4 DIV to E14.5 + 4 DIV. In contrast, approximately half of the cells from theHes1−/− brain died within 4 DIV, independent of their original developmental stage. F, Apoptosis rescued with NT-3. Dissociated telencephalic cells from E12.5 wild-type (wild) and Hes1−/−(Hes1−/−) mice were cultured for 4 DIV in defined medium (control). Twenty nanograms per milliliter NT-3 was added to this defined medium for assessing rescue from apoptosis by NT-3. The percentage of apoptotic cells in the telencephalic cultures was estimated at 4 DIV based on nuclear staining, and presented in each bar as the means ± SEM of at least three independent experiments. *p < 0.01 in comparison with wild-type or control. A large fraction of apoptotic cells was observed in theHes1−/− cultures in the absence of NT-3 (control), which was markedly reduced by the administration of NT-3. In contrast, NT-3 had only a small effect on the level of apoptosis in the wild-type cultures.

References

    1. Akazawa C, Sasai Y, Nakanishi S, Kageyama R. Molecular characterization of a rat negative regulator with a basic helix-loop-helix structure predominantly expressed in the developing nervous system. J Biol Chem. 1992;267:21879–21885. - PubMed
    1. Artavanis-Tsakonas S, Matsuno K, Fortini ME. Notch signaling. Science. 1995;268:225–232. - PubMed
    1. Artavanis-Tsakonas S, Rand MD, Lake RJ. Notch signaling: cell fate control and signal integration in development. Science. 1999;284:770–776. - PubMed
    1. Bayer SA, Altman J. Neocortical development. Raven; New York: 1991.
    1. Blaschke AJ, Staley K, Chun J. Widespread programmed cell death in proliferative and postmitotic regions of the fetal cerebral cortex. Development. 1996;122:1165–1174. - PubMed

Publication types

MeSH terms