. 2000 Jan 1;20(1):470-84.
doi: 10.1523/JNEUROSCI.20-01-00470.2000.

Membrane potential and firing rate in cat primary visual cortex

Affiliations

Membrane potential and firing rate in cat primary visual cortex

M Carandini et al. J Neurosci. .

Abstract

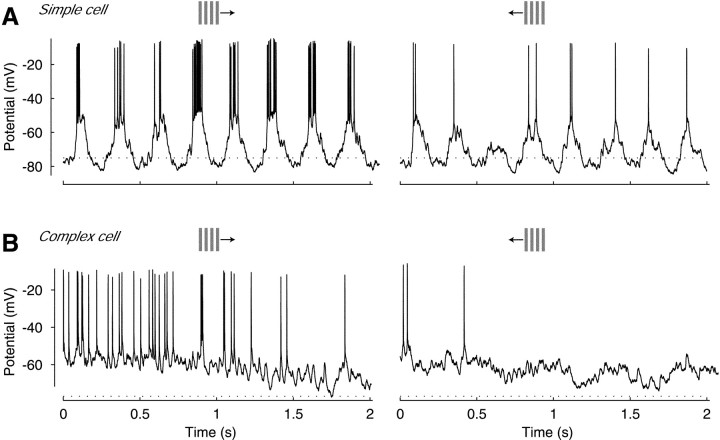
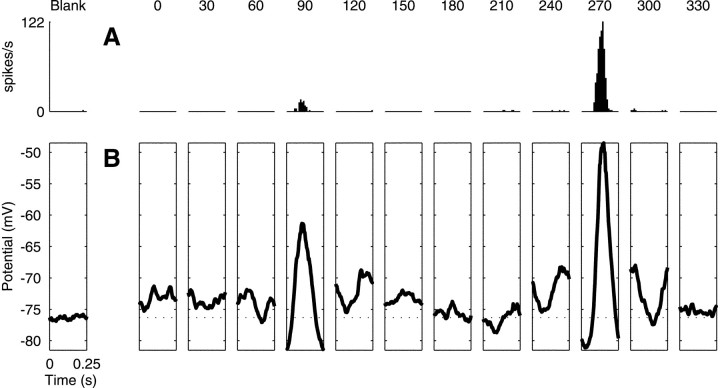
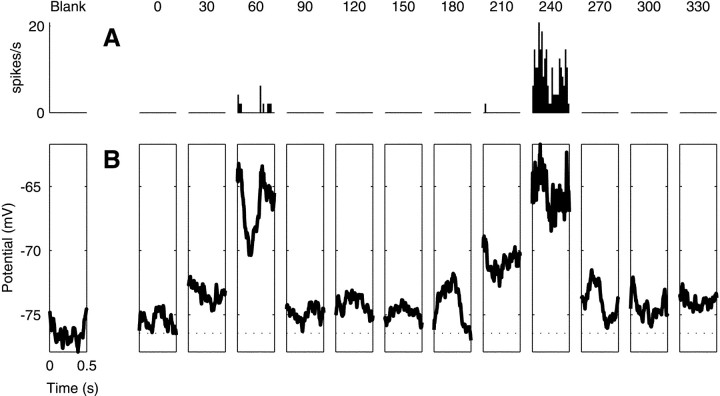
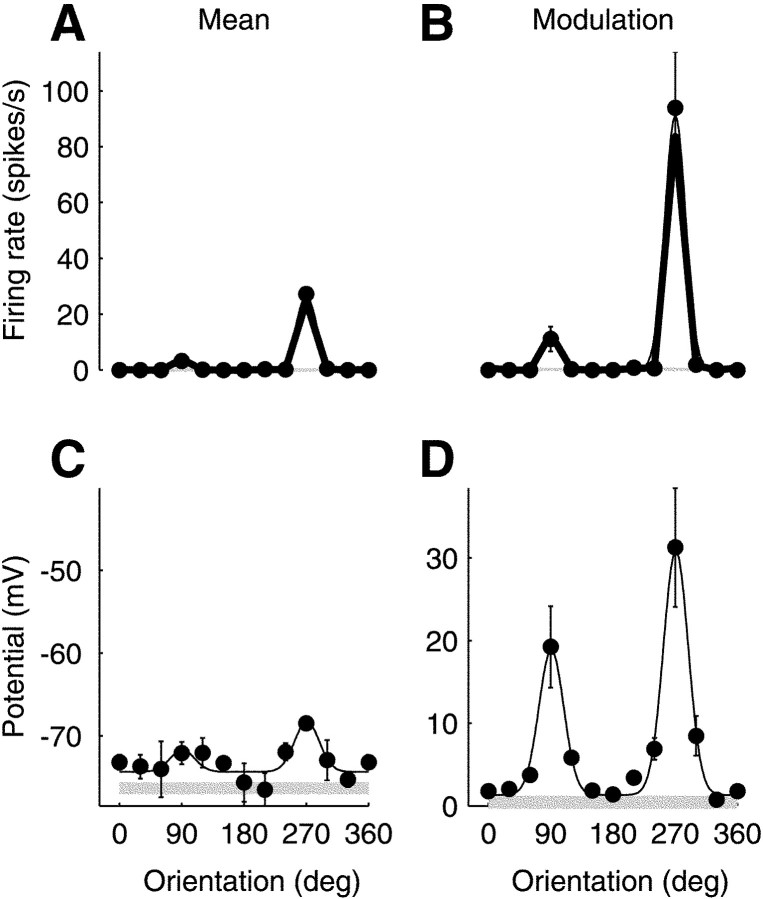
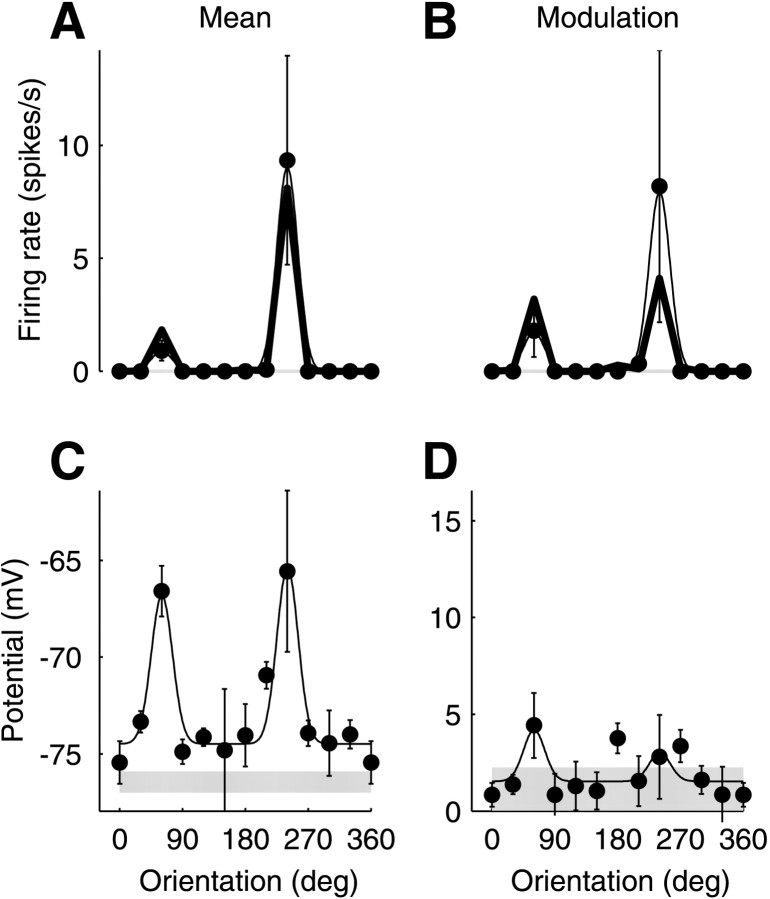
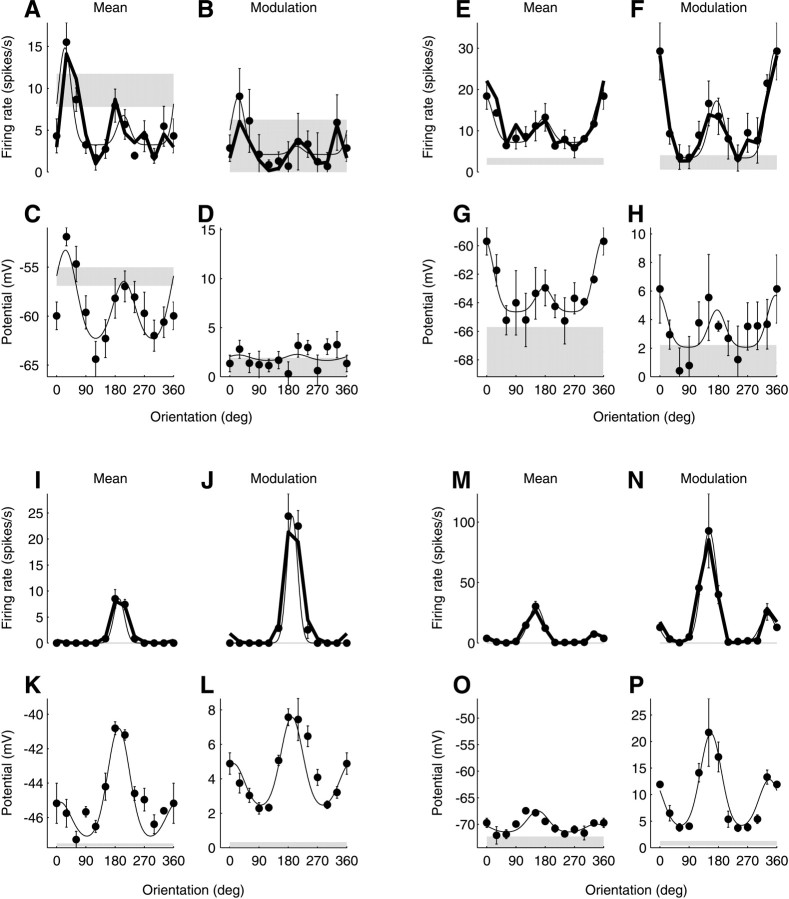
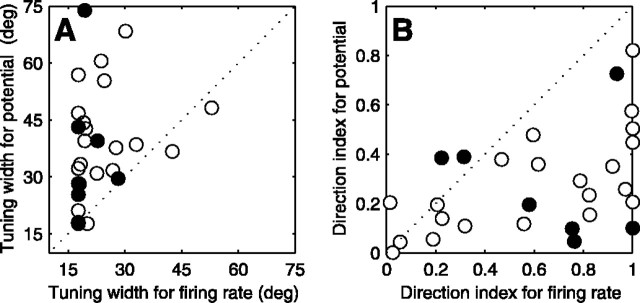
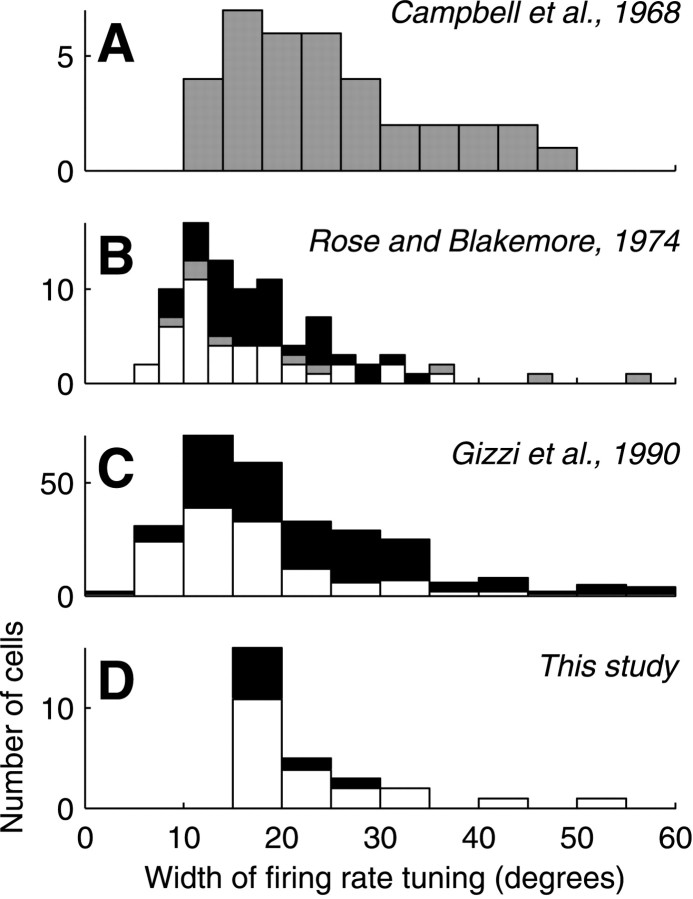
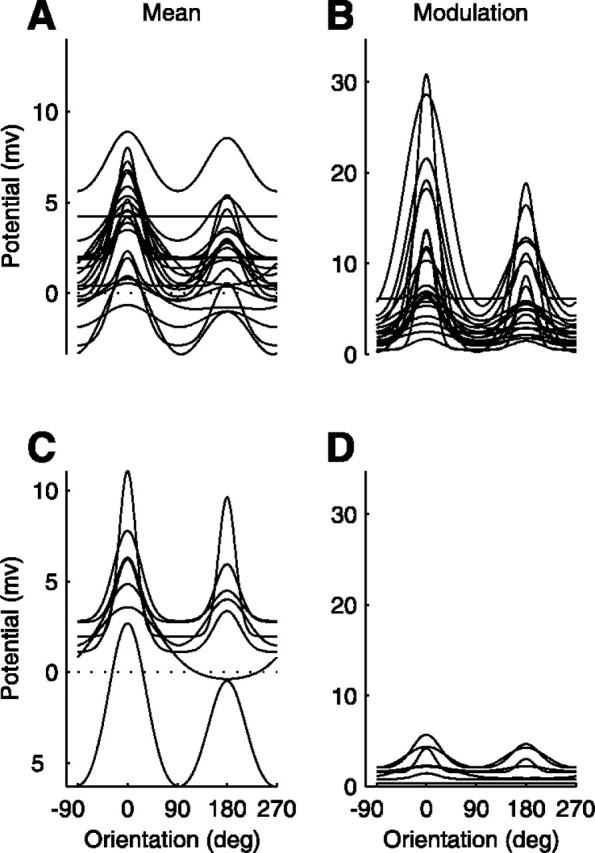
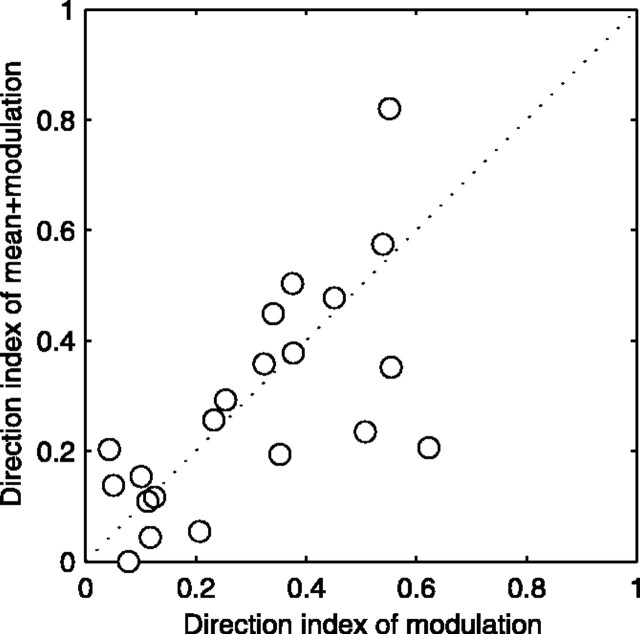
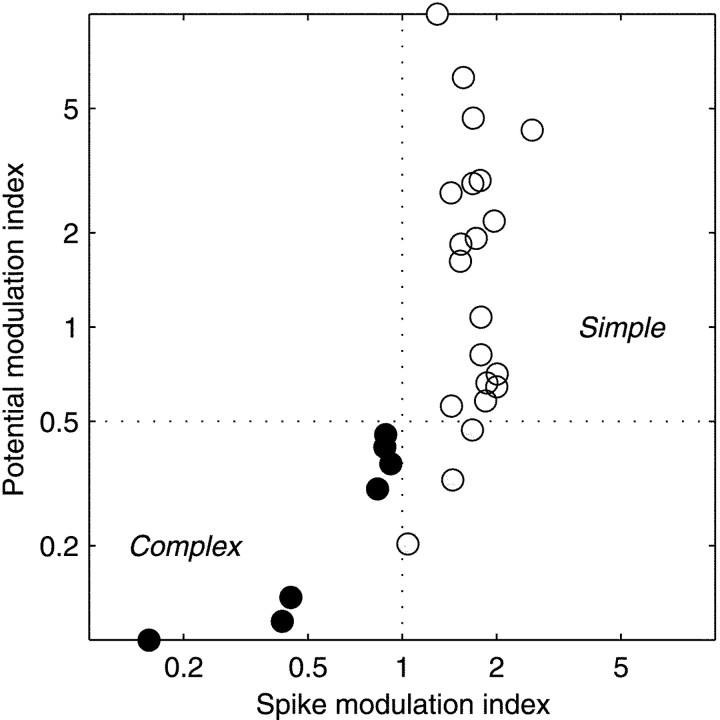
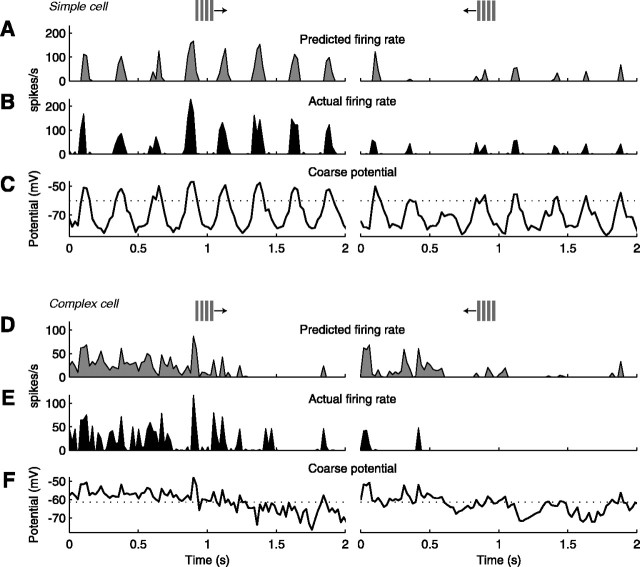
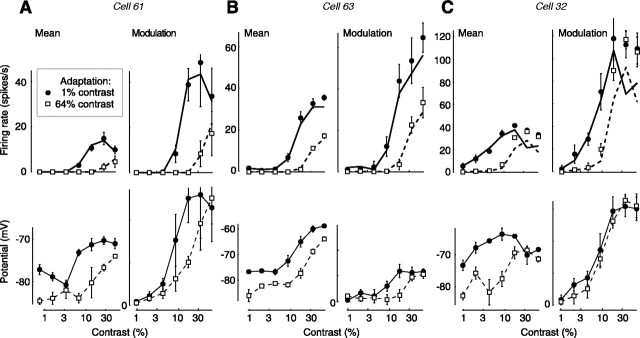
We have investigated the relationship between membrane potential and firing rate in cat visual cortex and found that the spike threshold contributes substantially to the sharpness of orientation tuning. The half-width at half-height of the tuning of the spike responses was 23 +/- 8 degrees, compared with 38 +/- 15 degrees for the membrane potential responses. Direction selectivity was also greater in spike responses (direction index, 0.61 +/- 0.35) than in membrane potential responses (0.28 +/- 0.21). Threshold also increased the distinction between simple and complex cells, which is commonly based on the linearity of the spike responses to drifting sinusoidal gratings. In many simple cells, such stimuli evoked substantial elevations in the mean potential, which are nonlinear. Being subthreshold, these elevations would be hard to detect in the firing rate responses. Moreover, just as simple cells displayed various degrees of nonlinearity, complex cells displayed various degrees of linearity. We fitted the firing rates with a classic rectification model in which firing rate is zero at potentials below a threshold and grows linearly with the potential above threshold. When the model was applied to a low-pass-filtered version of the membrane potential (with spikes removed), the estimated values of threshold (-54.4 +/- 1.4 mV) and linear gain (7.2 +/- 0.6 spikes. sec(-1). mV(-1)) were similar across the population. The predicted firing rates matched the observed firing rates well and accounted for the sharpening of orientation tuning of the spike responses relative to that of the membrane potential. As it was for stimulus orientation, threshold was also independent of stimulus contrast. The rectification model accounted for the dependence of spike responses on contrast and, because of a stimulus-induced tonic hyperpolarization, for the response adaptation induced by prolonged stimulation. Because gain and threshold are unaffected by visual stimulation and by adaptation, we suggest that they are constant under all conditions.


Figures

Fig. 1.
Fig. 1.
Membrane potential responses of two cells to stimuli of preferred orientation drifting in the preferred direction (left) and in the nonpreferred (opposite) direction (right). A, Responses of a simple cell (cell 61). The grating stimulus drifted at 4 Hz. Each bar of the grating elicited a strong modulation in the membrane potential response. B, Responses of a complex cell (cell 24). The grating stimulus drifted at 2 Hz. The responses it elicited contained only a mild component at the stimulus frequency. The dotted horizontal lines indicate the resting potential.
Fig. 2.
Fig. 2.
Cycle averages and spike histograms, as a function of stimulus orientation, for the simple cell in Figure1A. The first column refers to a blank stimulus, and the subsequent columns refer to 12 stimulus orientations, spanning the range between 0 and 360° in 30° steps. Responses are averaged over one stimulus cycle (0.25 sec).A, Firing rate. B, Membrane potential. Cell 61.
Fig. 3.
Fig. 3.
Cycle averages and spike histograms, as a function of stimulus orientation, for the complex cell in Figure1B. Format as in Figure 2. Responses are averaged over one stimulus cycle (0.5 sec). Cell 24.
Fig. 4.
Fig. 4.
Orientation tuning of the simple cell in Figures1A and 2. Top, Firing rate.Bottom, Membrane potential. Left, Mean responses. Right, Response modulation.Gray areas indicate confidence intervals for the responses to a blank stimulus. Their width and the length of the error bars on the data points are twice the SE of the measurements. In thetop panels the confidence intervals are infinitesimal: the response to the blank was always 0 spikes/sec. The thin curves indicate the fits of a descriptive tuning curve (Eq. 1). The thick lines in the top panelsindicate the predictions of the rectification model of firing rate, obtained from the membrane potential responses. Cell 61.
Fig. 5.
Fig. 5.
Orientation tuning of the complex cell of Figures1B and 3. Format as in Figure 4. Cell 24.
Fig. 6.
Fig. 6.
Orientation tunings of two complex cells and two simple cells. The format of each group of four panels is as in Figure4. A–D, E–G, Complex cells (cells 86 and 28).I–L, M–P, Simple cells (cells 68 and 71). These cells are arranged in order of spike modulation index: 0.88, 0.92, 1.43, and 1.54. The corresponding potential modulation indices are 0.41, 0.37, 0.56, and 1.84.
Fig. 7.
Fig. 7.
Comparison of orientation tuning in the membrane potential responses and in the firing rate responses. A, Orientation tuning width at half-height, obtained from fits such as those in Figure 6. B, Direction index, computed from the sum of the mean and modulation components. Open symbols, Simple cells; filled symbols, complex cells.Lines mark the identity between abscissaand ordinate.
Fig. 8.
Fig. 8.
Orientation tuning of the firing rate responses as measured in published extracellular studies and in our intracellular recordings. The measure of tuning width in the abscissais the half-width at half-height. A, Replotted fromCampbell et al. (1968), who used drifting square grating stimuli.B, Replotted from Rose and Blakemore (1974a), who used drifting bar stimuli. C, Replotted from Gizzi et al. (1990), who used drifting sinusoidal grating stimuli. D, Our data. In all panels, white indicates simple cells,black indicates complex cells, and grayindicates unclassified cells.
Fig. 9.
Fig. 9.
Summary of orientation tuning of the membrane potential. Curves are the fits of the descriptive tuning function (Eq. 1), aligned so that the preferred orientation and direction for the modulated component would be at 0°.A, B, Mean and modulation of membrane potential in 21 simple cells. C, D, Mean and modulation of membrane potential in 7 complex cells.
Fig. 10.
Fig. 10.
Impact of nonlinearity on direction selectivity of the membrane potential responses of 21 simple cells. The direction index obtained from the sum of the mean and modulated components of the responses (ordinate) is plotted against the direction index obtained from the modulated components of the responses (abscissa).
Fig. 11.
Fig. 11.
Distribution of the modulation indices for the membrane potential and for the firing rate. The vertical line indicates a standard criterion for classifying simple and complex cells based on the spike responses (Skottun et al., 1991).Filled symbols indicate cells that are defined as complex (spike modulation index, <1). Open symbolsindicate cells that are defined as simple (spike modulation index, >1). The horizontal line indicates a possible criterion to classify cells based on their membrane potential responses.
Fig. 12.
Fig. 12.
Coarse potentials and firing rates and fits of the rectification model. A–C, Results for the simple cell in Figures 1A, 2, and 4 (cell 61).D–F, Results for the complex cell in Figures1B, 3, and 5 (cell 24). The results are plotted for the responses to stimuli having the preferred orientation and drifting in the preferred direction (left panels) or the opposite direction (right panels). The coarse potentials are plotted in C and F. The firing rates are plotted in B and E, and their estimation from the coarse potential, using the rectification model, is shown in A and D. Thelines over the coarse potential traces indicate the estimated thresholds.
Fig. 13.
Fig. 13.
Contrast responses of three simple cells and effects of pattern adaptation. For each cell, mean (left) and modulation (right) are plotted for the firing rate (top) and membrane potential responses (bottom) as a function of stimulus contrast.Filled symbols indicate responses obtained while adapting to low contrast (1%); open symbols indicate responses obtained while adapting to high contrast (47%). Solid curves are predictions of the rectification model, obtained from the membrane potential responses. Error bars are twice the SE of the measurements. The cell in A is the same as in Figures 1A, 2, and 4. Data in Cwere published by Carandini and Ferster (1997). Cells 61, 63, and 32.

References

    1. Abbott LF, Varela JA, Sen K, Nelson SB. Synaptic depression and cortical gain control. Science. 1997;275:220–224. - PubMed
    1. Ahmed B, Anderson JC, Douglas RJ, Martin KA, Whitteridge D. Estimates of the net excitatory currents evoked by visual stimulation of identified neurons in cat visual cortex. Cereb Cortex. 1998;8:462–476. - PubMed
    1. Albrecht DG, Geisler WS. Motion sensitivity and the contrast-response function of simple cells in the visual cortex. Vis Neurosci. 1991;7:531–546. - PubMed
    1. Albrecht DG, Farrar SB, Hamilton DB. Spatial contrast adaptation characteristics of neurones recorded in the cat's visual cortex. J Physiol (Lond) 1984;347:713–739. - PMC - PubMed
    1. Ben-Yishai R, Lev Bar Or R, Sompolinsky H. Theory of orientation tuning in the visual cortex. Proc Natl Acad Sci USA. 1995;92:3844–3848. - PMC - PubMed

Publication types