. 2000 Feb;20(3):805-15.
doi: 10.1128/MCB.20.3.805-815.2000.

Tight control of respiration by NADH dehydrogenase ND5 subunit gene expression in mouse mitochondria

Affiliations

Tight control of respiration by NADH dehydrogenase ND5 subunit gene expression in mouse mitochondria

Y Bai et al. Mol Cell Biol. 2000 Feb.

Abstract

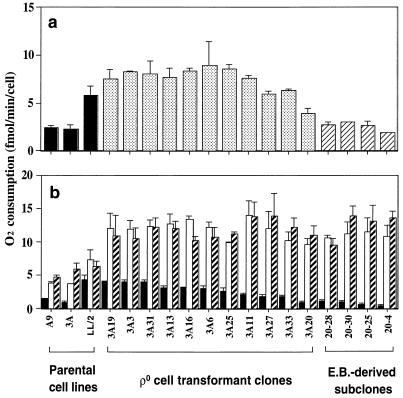
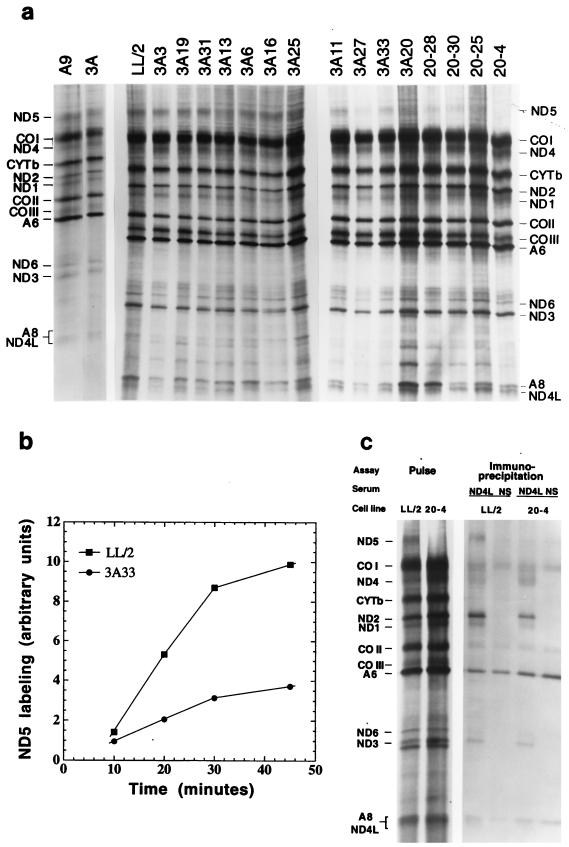
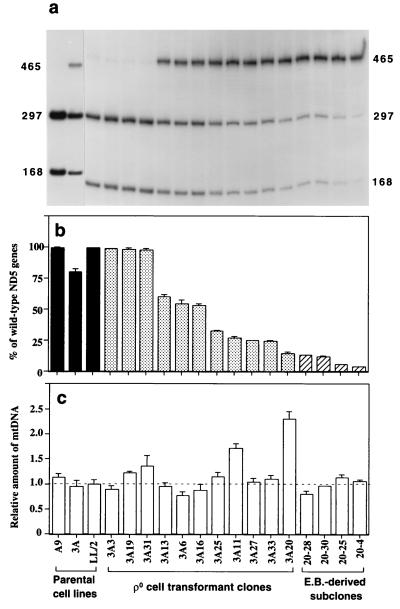
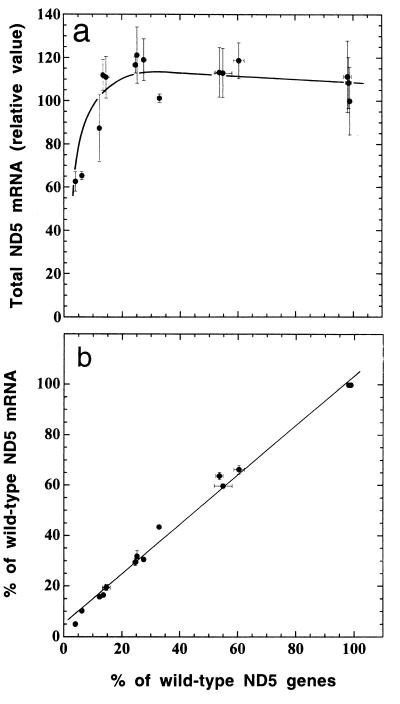
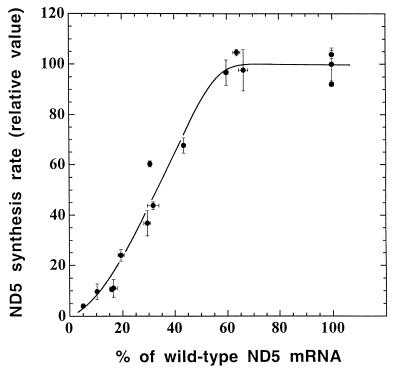
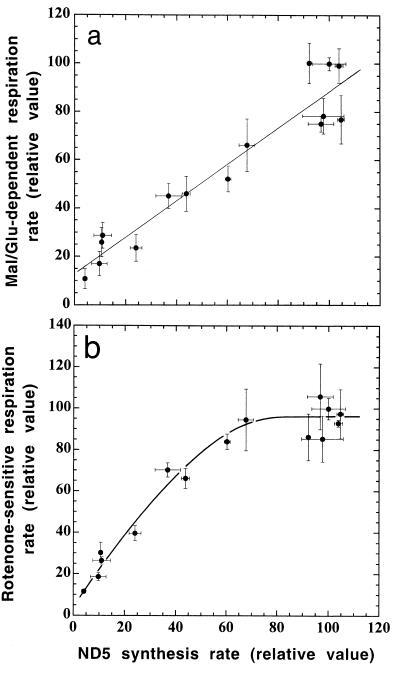
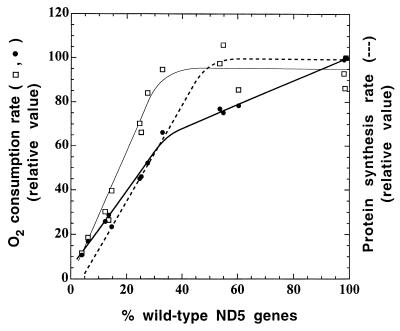
A mouse cell variant carrying in heteroplasmic form a nonsense mutation in the mitochondrial DNA-encoded ND5 subunit of the respiratory NADH dehydrogenase has been isolated and characterized. The derivation from this mutant of a large number of cell lines containing between 4 and 100% of the normal number of wild-type ND5 genes has allowed an analysis of the genetic and functional thresholds operating in mouse mitochondria. In wild-type cells, approximately 40% of the ND5 mRNA level was in excess of that required for ND5 subunit synthesis. However, in heteroplasmic cells, the functional mRNA level decreased in proportion to the number of wild-type ND5 genes over a 25-fold range, pointing to the lack of any compensatory increase in rate of transcription and/or stability of mRNA. Most strikingly, the highest ND5 synthesis rate was just sufficient to support the maximum NADH dehydrogenase-dependent respiration rate, with no upregulation of translation occurring with decreasing wild-type mRNA levels. These results indicate that, despite the large excess of genetic potential of the mammalian mitochondrial genome, respiration is tightly regulated by ND5 gene expression.


Figures

FIG. 1
FIG. 1
Total respiration rate (a) and activities of the enzymes of the mitochondrial respiratory chain (b) in the three parental cell lines (A9, 3A, and LL/2), 11 ρ° LL/2-m21 cell transformants, and 4 3A-20 ethidium bromide (E.B.)-treated derivatives. In both panels, the data are displayed in the following order: first for the A9, 3A, and LL/2 cell lines; then for the transformants; and, finally, the 4 3A-20 derivatives. The cell lines in the latter two groups are arranged in order of decreasing malate-glutamate-dependent respiration. In panel a, the total respiration rate was measured on ∼2 × 10⁶ cells. In panel b, the activities of the various components of the respiratory chain were determined on 2 × 10⁶ cells as respiration dependent on malate-glutamate (solid bars), succinate–G-3-P (open bars), and TMPD-ascorbate (hatched bars). Three to five determinations were made for each cell line. The error bars indicate the standard error of the mean (SEM).
FIG. 2
FIG. 2
Electrophoretic analysis of SDS mitochondrial lysates from the [35S]methionine 30-min-pulse-labeled 3 parental lines, 11 ρ° LL/2-m21 transformants, and 4 ethidium bromide-derived 3A20 subclones (a), kinetics of the ND5 labeling in LL/2 and 3A33 cells (b), and electrophoretic patterns of immunoprecipitates obtained from Triton X-100 mitochondrial lysates of pulse-chased LL/2 and 3A20-4 cells with gamma globulins from an antiserum against the human ND4L subunit (ND4L) or from normal rabbit serum (NS) (c). For details, see Materials and Methods. In panel a, the patterns for the transformants and 3A20-4 are arranged, with minor deviations, in the order of decreasing malate-glutamate-dependent respiration rate.
FIG. 3
FIG. 3
Quantification of the A12081C mutation, by ClaI digestion of a PCR-amplified ND5 fragment (a and b), and of total mtDNA content, by slot blot hybridization analysis (c), in the parental cell lines, transformants, and ethidium bromide (E.B.)-derived 3A20 subclones. In panel c, the mtDNA content of the various cell lines is expressed relative to the value in LL/2 cells. Two determinations of the proportion of wild-type ND5 genes and three to six determinations of mtDNA content were made for each cell line. The error bars indicate the SEM.
FIG. 4
FIG. 4
Quantification of total ND5 mRNA in the ρ° LL/2-m21 transformants and ethidium bromide-derived 3A20 subclones by RNA transfer hybridization (a) and relationship of the proportion of wild-type ND5 mRNA, as determined by RT-PCR, to the proportion of wild-type ND5 genes (b). The average total ND5 mRNA content per cell was normalized as detailed in the text and expressed relative to the value for the transformant 3A3, which has virtually 100% wild-type ND5 genes (Fig. 3b). Three to five determinations of total ND5 mRNA content and three determinations of the proportion of wild-type ND5 mRNA by RT-PCR were made for each cell line. The error bars represent the SEM; the error bars that fall within the individual data symbols are not shown.
FIG. 5
FIG. 5
Relationship between the ND5 synthesis rate, expressed relative to the rate in the 3A3 transformant, and the proportion of wild-type ND5 mRNA in the ρ° LL/2-m21 transformants and ethidium bromide-derived 3A20 subclones. The individual values for the rate of ND5 protein labeling, as determined by laser densitometry of appropriately exposed fluorograms, were normalized to the overall protein labeling. Two independent labeling experiments and two electrophoretic analyses of the mitochondrial translation products after each labeling were performed for each cell line. Almost identical curves were obtained by measuring the intensities of the ND5 bands by phosphorimager analysis and/or normalizing the data to the intensities of the CYTb and/or ND2 band (not shown). Symbols are as defined for Fig. 4.
FIG. 6
FIG. 6
Relationship between rate of malate-glutamate-dependent respiration (a) or rate of rotenone-sensitive respiration (b), as expressed relative to the rate in the 3A3 transformant, and relative ND5 synthesis rate in the ρ° LL/2-m21 transformants and ethidium bromide-derived 3A20 subclones. Symbols are as defined for Fig. 4.
FIG. 7
FIG. 7
Relationship between malate-glutamate-dependent respiration rate (●) or rotenone-sensitive respiration rate (□), as expressed relative to the rate in the 3A3 transformant, and proportion of wild-type ND5 genes in the ρ° LL/2-m21 transformants and ethidium bromide-derived 3A20 subclones. For comparison, the relative rate of ND5 protein synthesis (dashed line) is also shown.

References

    1. Ammini C V, Hauswirth W W. Mitochondrial gene expression is regulated at the level of transcription during early embryogenesis of Xenopus laevis. J Biol Chem. 1999;274:6265–6271. - PubMed
    1. Attardi G. Animal mitochondrial DNA: an extreme example of genetic economy. Int Rev Cytol. 1985;93:93–145. - PubMed
    1. Attardi G, Schatz G. Biogenesis of mitochondria. Annu Rev Cell Biol. 1988;4:289–333. - PubMed
    1. Attardi G, Chomyn A, Loguercio P. Evidence for translational control of mitochondrial gene expression in rat muscle and brain synaptosome mitochondria. In: Benzi G, editor. Advances in myochemistry. Vol. 2. London, England: John Libbey Eurotext, Ltd.; 1989. pp. 55–64.
    1. Bai Y D, Attardi G. The mtDNA-encoded ND6 subunit of mitochondrial NADH dehydrogenase is essential for the assembly of the membrane arm and the respiratory function of the enzyme. EMBO J. 1998;17:4848–4858. - PMC - PubMed

Publication types

LinkOut - more resources