. 2000 Jan 10;148(1):127-36.
doi: 10.1083/jcb.148.1.127.

Cell spreading and lamellipodial extension rate is regulated by membrane tension

Affiliations

Cell spreading and lamellipodial extension rate is regulated by membrane tension

D Raucher et al. J Cell Biol. .

Abstract

Cell spreading and motility require the extension of the plasma membrane in association with the assembly of actin. In vitro, extension must overcome resistance from tension within the plasma membrane. We report here that the addition of either amphiphilic compounds or fluorescent lipids that expanded the plasma membrane increased the rate of cell spreading and lamellipodial extension, stimulated new lamellipodial extensions, and caused a decrease in the apparent membrane tension. Further, in PDGF-stimulated motility, the increase in the lamellipodial extension rate was associated with a decrease in the apparent membrane tension and decreased membrane-cytoskeleton adhesion through phosphatidylinositol diphosphate hydrolysis. Conversely, when membrane tension was increased by osmotically swelling cells, the extension rate decreased. Therefore, we suggest that the lamellipodial extension process can be activated by a physical signal (perhaps secondarily), and the rate of extension is directly dependent upon the tension in the plasma membrane. Quantitative analysis shows that the lamellipodial extension rate is inversely correlated with the apparent membrane tension. These studies describe a physical chemical mechanism involving changes in membrane-cytoskeleton adhesion through phosphatidylinositol 4,5-biphosphate-protein interactions for modulating and stimulating the biochemical processes that power lamellipodial extension.


Figures

Figure 1
Figure 1
Effect of membrane expanding reagent, deoxycholate, on cell spreading. After brief trypsinization, NIH 3T3 cells were plated on acid-washed glass coverslips either without or with 0.4 mM of deoxycholate added to the medium. Coverslips were washed and fixed with 4% paraformaldehyde after 15 or 30 min. Adherent cells were counted by visual examination with DIC microscopy (see micrographs of cell spreading without [a] or with [b] deoxycholate), and the relative number of spread cells with respect to the control cells was calculated (c) represent the average of three independent experiments, in each of which >500 cells were counted). Error bars are SEM.
Figure 1
Figure 1
Effect of membrane expanding reagent, deoxycholate, on cell spreading. After brief trypsinization, NIH 3T3 cells were plated on acid-washed glass coverslips either without or with 0.4 mM of deoxycholate added to the medium. Coverslips were washed and fixed with 4% paraformaldehyde after 15 or 30 min. Adherent cells were counted by visual examination with DIC microscopy (see micrographs of cell spreading without [a] or with [b] deoxycholate), and the relative number of spread cells with respect to the control cells was calculated (c) represent the average of three independent experiments, in each of which >500 cells were counted). Error bars are SEM.
Figure 2
Figure 2
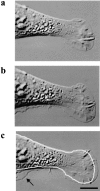
Lamellipodial extension in NIH 3T3 cells. (a) Photomicrograph of an NIH 3T3 cell observed during the initial formation of a lamellipodial protrusion. (b) The same cell 1 min after solution was rapidly exchanged with a solution containing 0.4 mM deoxycholic acid. (c) The cell after 2 min in the deoxycholate solution. For comparison, the outline represents the initial cell contour from a. Bar, 10 μm. (d) Lamellipodial extension rates were averaged over 40–60 s by fitting a straight line to a plot of distance moved versus time, with the position measured every 3 s. The distance moved was defined as the distance from the initial position of the lamellipodial edge at the beginning of extension (inset). For all cells shown, the rate remained roughly constant over the period of observation (r2 > 0.96 for every fitted line). (e) Average lamellipodial extension rate in control medium, the presence of 0.4 mM deoxycholate, 1% ethanol, or 0.1 mM DiA-treated cells. Error bars show SEM for three to five measurements for 10–12 cells. (f) The number of lamellipodial extensions was monitored for 10 min before the addition (at time zero) and 10 min after the addition of deoxycholate (top). In each minute, the number of lamellipodial extensions (extending for longer than 25 s) was counted, normalized to total number of lamellipodial extensions during the 10 min before the addition of deoxycholate, and averaged for at least 20 cells. The bottom represents the control experiment, where at time zero only fresh medium was added. Error bars represent SEM.
Figure 2
Figure 2
Lamellipodial extension in NIH 3T3 cells. (a) Photomicrograph of an NIH 3T3 cell observed during the initial formation of a lamellipodial protrusion. (b) The same cell 1 min after solution was rapidly exchanged with a solution containing 0.4 mM deoxycholic acid. (c) The cell after 2 min in the deoxycholate solution. For comparison, the outline represents the initial cell contour from a. Bar, 10 μm. (d) Lamellipodial extension rates were averaged over 40–60 s by fitting a straight line to a plot of distance moved versus time, with the position measured every 3 s. The distance moved was defined as the distance from the initial position of the lamellipodial edge at the beginning of extension (inset). For all cells shown, the rate remained roughly constant over the period of observation (r2 > 0.96 for every fitted line). (e) Average lamellipodial extension rate in control medium, the presence of 0.4 mM deoxycholate, 1% ethanol, or 0.1 mM DiA-treated cells. Error bars show SEM for three to five measurements for 10–12 cells. (f) The number of lamellipodial extensions was monitored for 10 min before the addition (at time zero) and 10 min after the addition of deoxycholate (top). In each minute, the number of lamellipodial extensions (extending for longer than 25 s) was counted, normalized to total number of lamellipodial extensions during the 10 min before the addition of deoxycholate, and averaged for at least 20 cells. The bottom represents the control experiment, where at time zero only fresh medium was added. Error bars represent SEM.
Figure 3
Figure 3
Tether force measurements. (a) Video-enhanced DIC micrograph of membrane tension measurement. Polystyrene beads were coated with mouse IgG and attached to the plasma membrane by holding them on the membrane surface, and tethers (denoted by arrow) were formed by pulling on the beads with the laser tweezers. (b) Displacement of the bead from the center of the laser trap was measured during tether formation. From calibration of the tweezers (Kuo and Sheetz 1993) displacement may be converted to the tether force (force needed to hold the tether at a constant length). (c) Average tether force in control cells, 0.4 mM deoxycholate, 1% ethanol, or 0.1 mM DiA-treated cells. Error bars show SEM for 12–16 cells from two to five measurements.
Figure 4
Figure 4
Tether force and lamellipodial extension rate after incorporation of fluorescent phospholipids into the plasma membrane. Fluorescence micrographs of NIH 3T3 fibroblasts plasma membrane fluorescence after incubation with the following: (a) C5-DMB-SM; (b) FITC-PL; and (c) Phosphatidylcholine analogue (β-DPH-HPC). (d) Average relative tether force and average relative lamellipodial extension rate in NIH 3T3 fibroblasts after the incubation with various fluorescent phospholipids.
Figure 4
Figure 4
Tether force and lamellipodial extension rate after incorporation of fluorescent phospholipids into the plasma membrane. Fluorescence micrographs of NIH 3T3 fibroblasts plasma membrane fluorescence after incubation with the following: (a) C5-DMB-SM; (b) FITC-PL; and (c) Phosphatidylcholine analogue (β-DPH-HPC). (d) Average relative tether force and average relative lamellipodial extension rate in NIH 3T3 fibroblasts after the incubation with various fluorescent phospholipids.
Figure 5
Figure 5
Lamellipodial extension rates and tether force are inversely proportional. (a) Tether force after application of increasing concentration of deoxycholate. (b) Lamellipodial extension rates in increasing concentrations of deoxycholate. (c) Lamellipodial extension rates versus tether force for various concentrations of deoxycholate, 0.1 mM fluorescent dye DiA, fluorescent phospholipids from Fig. 4, and hypotonic solution represented in Fig. 6.
Figure 6
Figure 6
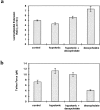
Lamellipodial extension rates and tether force measurements in hypotonic media. (a) Tether force measured after 3 min in hypotonic solution (30% dH2O), after the hypotonic solution was combined with 0.4 mM deoxycholic acid, or after 0.4 mM deoxycholic acid alone. (b) Lamellipodial extension rates measured under same conditions as in a.
Figure 7
Figure 7
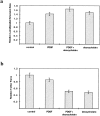
Tether force and lamellipodial extension rate after PDGF activation. (a) Lamellipodial extension rates measured after 5 min in 40 ng/ml PDGF, after PDGF was combined with 0.4 mM deoxycholic acid, and after 0.4 mM deoxycholic acid treatment alone. (b) Tether force measured under same conditions as in a. (c) Lamellipodial extension rates measured after 5 min in 40 ng/ml PDGF, after PDGF was combined with 1 μm U73122, and after 1 μm U73122 treatment alone. (d) Tether force measured under same conditions as in c.
Figure 7
Figure 7
Tether force and lamellipodial extension rate after PDGF activation. (a) Lamellipodial extension rates measured after 5 min in 40 ng/ml PDGF, after PDGF was combined with 0.4 mM deoxycholic acid, and after 0.4 mM deoxycholic acid treatment alone. (b) Tether force measured under same conditions as in a. (c) Lamellipodial extension rates measured after 5 min in 40 ng/ml PDGF, after PDGF was combined with 1 μm U73122, and after 1 μm U73122 treatment alone. (d) Tether force measured under same conditions as in c.
Figure 8
Figure 8
PDGF and membrane expanding reagents initiate the generation of new lamellipodial extensions and stimulate lamellipodial extension rates. (a) A rapid drop in membrane tension caused by PDGF or membrane expanding reagents initiates the generation of new lamellipodial extensions. (b) There is an inverse relationship between tension and extension rate, and tension changes caused by PDGF, or membrane expanding reagents, can stimulate the biochemical processes underlying extension, such as actin polymerization.

References

    1. Abercrombie M., Heaysman J.E., Pegrum S.M. The locomotion of fibroblasts in culture. 3. Movements of particles on the dorsal surface of the leading lamella. Exp. Cell Res. 1970;62:389–398. - PubMed
    1. Bergman J.E., Kupfer A., Singer S.J. Membrane insertion and at the leading edge of motile fibroblasts. Proc. Natl. Acad. Sci. USA. 1983;80:1367–1371. - PMC - PubMed
    1. Bershadsky A.D., Futerman A.H. Disruption of the Golgi apparatus by brefeldin A blocks cell polarization and inhibits directed cell migration. Proc. Natl. Acad. Sci. USA. 1994;91:5686–5689. - PMC - PubMed
    1. Chen W.T. Mechanism of retraction of the trailing edge during fibroblast movement. J. Cell Biol. 1981;90:187–200. - PMC - PubMed
    1. Condeelis J. Life at the leading edgethe formation of cell protrusions. Annu. Rev. Cell Biol. 1993;9:411–444. - PubMed