

Developmental changes in eye-blink conditioning and neuronal activity in the cerebellar interpositus nucleus
- PMID: 10632611
- PMCID: PMC6772425
- DOI: 10.1523/JNEUROSCI.20-02-00813.2000
Developmental changes in eye-blink conditioning and neuronal activity in the cerebellar interpositus nucleus
Abstract
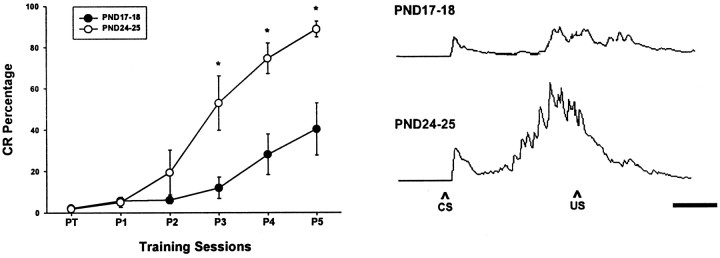
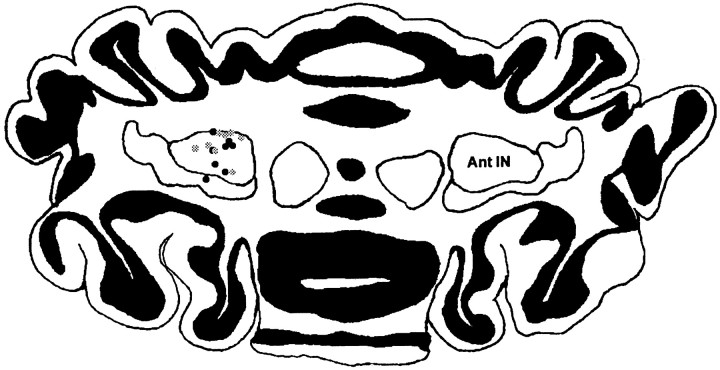
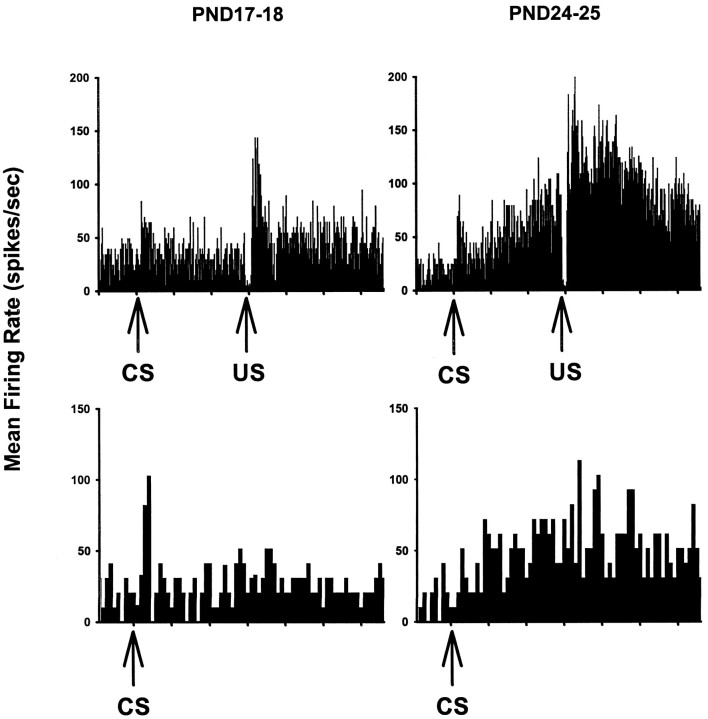
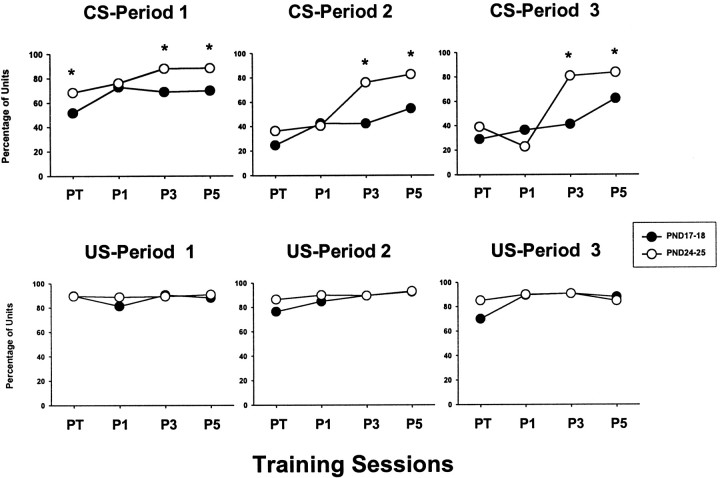
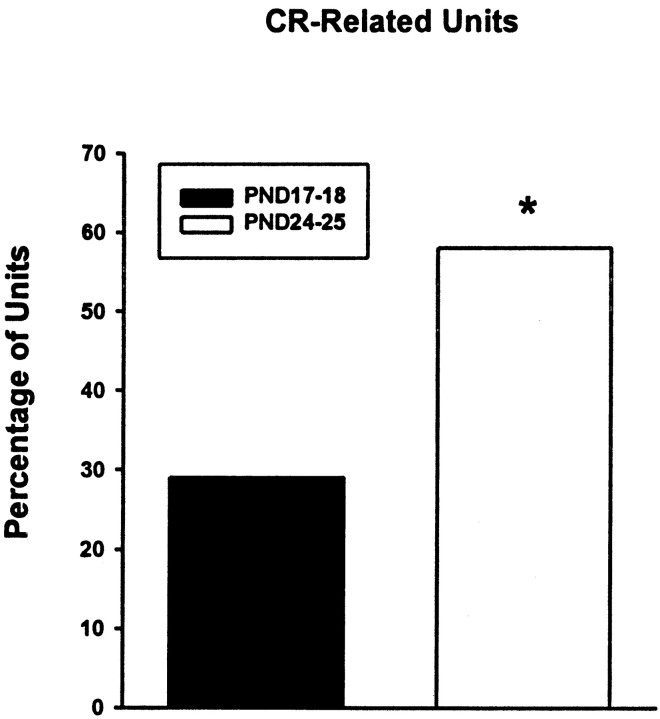
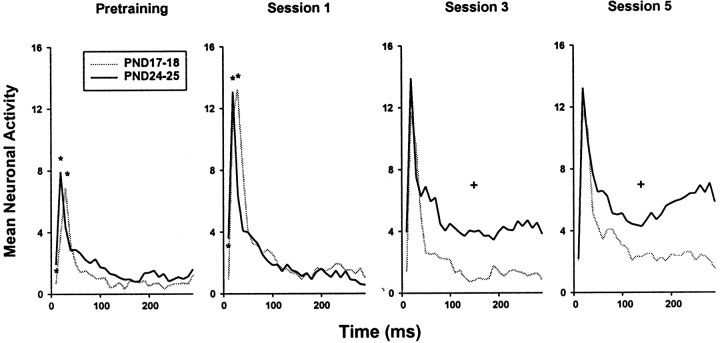
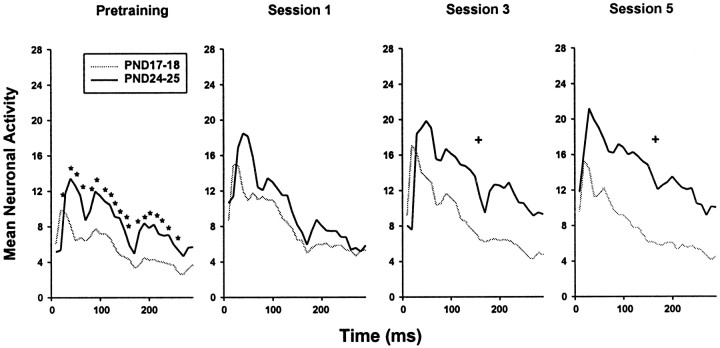
Neuronal activity was recorded in the cerebellar interpositus nucleus in infant rats during classical conditioning of the eye-blink response. The percentage and amplitude of eye-blink conditioned responses increased as a function of postnatal age. Learning-specific neuronal activity in the cerebellum emerged ontogenetically in parallel with the eye-blink conditioned response. There were also age-specific changes in neuronal activity after the onset of the conditioned and unconditioned stimuli. The results indicate that the development of the eye-blink conditioned response may depend on the development of stimulus-evoked neuronal responses and learning-specific plasticity in the cerebellum. Functional immaturity in the afferent neural pathways may limit the induction of neural plasticity in the cerebellum and thereby limit the development of the eye-blink conditioned response.
Figures
Similar articles
-
Developmental changes in eye-blink conditioning and neuronal activity in the inferior olive.J Neurosci. 2000 Nov 1;20(21):8218-26. doi: 10.1523/JNEUROSCI.20-21-08218.2000. J Neurosci. 2000. PMID: 11050145 Free PMC article.
-
Single-unit evidence for eye-blink conditioning in cerebellar cortex is altered, but not eliminated, by interpositus nucleus lesions.Learn Mem. 1997 May-Jun;4(1):88-104. doi: 10.1101/lm.4.1.88. Learn Mem. 1997. PMID: 10456056
-
The learning-related activity that develops in the pontine nuclei during classical eye-blink conditioning is dependent on the interpositus nucleus.Learn Mem. 1997 Mar-Apr;3(6):532-44. doi: 10.1101/lm.3.6.532. Learn Mem. 1997. PMID: 10456115
-
Ontogenetic changes in the neural mechanisms of eyeblink conditioning.Integr Physiol Behav Sci. 2001 Jan-Mar;36(1):15-35. doi: 10.1007/BF02733945. Integr Physiol Behav Sci. 2001. PMID: 11484994 Review.
-
The role of the cerebellum in classical conditioning of discrete behavioral responses.Neuroscience. 2009 Sep 1;162(3):732-55. doi: 10.1016/j.neuroscience.2009.01.041. Epub 2009 Jan 27. Neuroscience. 2009. PMID: 19409234 Review.
Cited by
-
Metabolic mapping of the rat cerebellum during delay and trace eyeblink conditioning.Neurobiol Learn Mem. 2007 Jul;88(1):11-8. doi: 10.1016/j.nlm.2007.03.008. Epub 2007 Apr 30. Neurobiol Learn Mem. 2007. PMID: 17468019 Free PMC article.
-
Developmental changes in eyeblink conditioning and neuronal activity in the pontine nuclei.Learn Mem. 2003 Sep-Oct;10(5):337-45. doi: 10.1101/lm.63703. Learn Mem. 2003. PMID: 14557606 Free PMC article.
-
Addition of inhibition in the olivocerebellar system and the ontogeny of a motor memory.Nat Neurosci. 2003 May;6(5):532-7. doi: 10.1038/nn1042. Nat Neurosci. 2003. PMID: 12692555 Free PMC article.
-
Ontogeny of trace eyeblink conditioning to shock-shock pairings in the rat pup.Behav Neurosci. 2013 Feb;127(1):114-20. doi: 10.1037/a0031298. Epub 2012 Dec 17. Behav Neurosci. 2013. PMID: 23244289 Free PMC article.
-
Unique neural circuitry for neonatal olfactory learning.J Neurosci. 2004 Feb 4;24(5):1182-9. doi: 10.1523/JNEUROSCI.4578-03.2004. J Neurosci. 2004. PMID: 14762136 Free PMC article.
References
-
- Altman J. Morphological development of the rat cerebellum and some of its mechanisms. In: Palay SL, Chan-Palay V, editors. The cerebellum: new vistas. Springer; Berlin: 1982. pp. 8–49.
-
- Anderson WA, Flumerfelt BA. Purkinje cell growth beyond the twenty-third postnatal day. Dev Brain Res. 1985;17:195–200. - PubMed
-
- Bartha GT, Thompson RF, Gluck MA. Sensorimotor learning and the cerebellum. In: Arbib ME, Ewert J, editors. Visual structures and integrated functions. Springer; Berlin: 1991. pp. 381–396.
-
- Berry M, Bradley P. The growth of dendritic trees of Purkinje cells in the cerebellum of the rat. Brain Res. 1976;112:1–35. - PubMed
-
- Berthier NE, Moore JW. Cerebellar Purkinje cell activity related to the classically conditioned nictitating membrane response. Exp Brain Res. 1986;63:341–350. - PubMed
MeSH terms
LinkOut - more resources
Full Text Sources