. 2000 Jan;12(1):23-33.
doi: 10.1105/tpc.12.1.23.

Determining the physical limits of the Brassica S locus by recombinational analysis

Affiliations

Determining the physical limits of the Brassica S locus by recombinational analysis

A L Casselman et al. Plant Cell. 2000 Jan.

Abstract

A genetic analysis was performed to study the frequency of recombination for intervals across the Brassica S locus region. No recombination was observed between the S locus glycoprotein gene and the S receptor kinase gene in the segregating populations that we analyzed. However, a number of recombination breakpoints in regions flanking these genes were identified, allowing the construction of an integrated genetic and physical map of the genomic region encompassing one S haplotype. We identified, based on the pollination phenotype of plants homozygous for recombinant S haplotypes, a 50-kb region that encompasses all specificity functions in the S haplotype that we analyzed. Mechanisms that might operate to preserve the tight linkage of self-incompatibility specificity genes within the S locus complex are discussed in light of the relatively uniform recombination frequencies that we observed across the S locus region and of the structural heteromorphisms that characterize different S haplotypes.


Figures

Figure 1.
Figure 1.
Segregation Analysis of F2 Plants Segregating for the S8 and Sf2 Haplotypes. The results of segregation analysis of SLG/SRK and of marker DD26 in a representative sample of 19 F2 plants are shown. Gel blots were prepared with HindIII-digested genomic DNA isolated from individual F2 plants. (A) Gel blot probed with the SLG probe. Restriction fragments marked with an asterisk correspond to the S genes derived from the Sf2 locus; those marked with a circle correspond to the SLG (20-kb fragment) and SRK (5.0-kb fragment) alleles derived from the S8 locus. The genotypes shown above each lane were determined by RFLP analysis, using the SLG probe (see Methods). (B) Gel blot probed with the DD26 probe. The blot in (A) was stripped and reprobed with DD26. Restriction fragments marked with an asterisk correspond to the DD26 allele found in the Sf2 parental line, and the restriction fragment marked with a circle corresponds to the DD26 allele present in the S8 parental line. The arrow marks an individual that is homozygous for the SLG/SRK alleles derived from the Sf2 locus but heterozygous at the DD26 locus. The genotype of this individual resulted from a recombination event between SLG and SRK on the one hand and DD26 on the other hand. Numbers at right indicate molecular lengths in kilobases.
Figure 2.
Figure 2.
Genetic Map of the S Locus Region and Location of Recombination Breakpoints within the S8 λ Contig. (A) Map of the 123-kb λ contig. SLG and SRK coding regions are designated by cross-hatched boxes. An interval of 13 kb between SLG8 and SRK8 cannot be cloned in λ and is shown as a striped box. The dotted lines from the ends of the λ contig to markers c31 and y14 are not drawn to scale. White boxes indicate fragments used as probes. Arrows indicate the 5′→3′ orientation of SLG8, SRK8, and SPA (the gene corresponding to DD15; Casselman et al., 2000). The A to E recombination breakpoints identified in this study are marked with X's on the map. (B) Genetic map of the S8 haplotype. All 16 probes used in this study are shown on the map. All numbers are in centimorgans and were calculated as described in the text. Markers shown at the same map position were not genetically separable. The total distance from DD70 to wg5A1 is 1.46 cM. The relationships between the maps in (A) and (B) are shown by dashed lines.
Figure 3.
Figure 3.
Identification of Recombinant S Haplotypes. A gel blot of HindIII-digested DNA was probed with the SLG probe (top) and subsequently with the sBH2.0 marker (bottom). Lane 1, a plant homozygous for the nonrecombinant S8 haplotype; lane 2, a plant homozygous for the Sf2 haplotype; and lanes 3 and 4, plants homozygous for the recombinant S haplotype resulting from a crossover event at breakpoint A (see Figure 2). These recombinants are homozygous for the SLG8 and SRK8 alleles but carry the sBH2.0 allele derived from the Sf2 haplotype. Numbers at right indicate molecular length in kilobases.
Figure 4.
Figure 4.
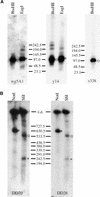
Physical Linkage of Markers in the S Locus Region. Genomic DNA prepared from S8 homozygotes was digested with BssHII and EagI (A) and with NotI and SfiI (B) and then separated by PFGE. (A) The PFGE blot was probed sequentially with wg5A1, y14, and s338. Fragments that hybridized with all probes are indicated with asterisks and circles. Probe s338 did not hybridize with an EagI fragment on this blot because the fragment was too small to be retained in the gel under the running conditions used. Less intense bands presumably are due to nonspecific hybridization. (B) The PFGE blot was probed sequentially with DD70 and DD26. Digestion of genomic DNA with SfiI often results in partial digestion, resulting in the two bands observed in the Sfi digest. The hybridization signal seen in the compression zone (c.z.) corresponds to undigested DNA often resulting from digestion with NotI and SfiI. The asterisks, circles, and plus signs mark restriction fragments that hybridized with both probes. Numbers between the gels indicate molecular length markers in kilobases.
Figure 5.
Figure 5.
Integrated Physical and Genetic Map of the Chromosomal Region Encompassing the S8 Haplotype. Map distances outside of the λ contig (hatched box) were compiled from PFGE analysis of S8S8genomic DNA and of two BAC clones. The kilobase-to-centimorgan ratios were calculated from the estimated physical distances and the genetic distances. Above the map are segments of the region contained in the restriction fragments shown in Figure 4: the 660-kb NotI restriction fragment (which includes markers DD70, DD26, and s338), the 240-kb SfiI restriction fragment (which includes markers DD70 and DD26), and the 97-kb BssHII restriction fragment (which includes markers wg5A1, y14, and s338). Below the map are shown the positions of the inserts in BAC F15 and BAC C16. Arrows at the end of the restriction fragments and of the BAC clones indicate that the segments/inserts extend an unknown distance in the direction of the arrow. Recombination breakpoints are marked by X's, and the positions of the A to E recombination breakpoints are shown. The exact location of breakpoints between DD70 and DD26 and between DD26 and c31 is not known.

References

    1. Awadalla, P., and Charlesworth, D. (1999). Recombination and selection at the Brassica self-incompatibility loci. Genetics 152 413–425. - PMC - PubMed
    1. Boyes, D.C., and Nasrallah, J.B. (1993). Physical linkage of the SLG and SRK genes at the self-incompatibility locus of Brassica oleracea. Mol. Gen. Genet. 236 369–373. - PubMed
    1. Boyes, D.C., and Nasrallah, J.B. (1995). An anther-specific gene encoded by an S locus haplotype of Brassica produces complementary and differentially regulated transcripts. Plant Cell 7 1283–1294. - PMC - PubMed
    1. Boyes, D.C., Nasrallah, M.E., Vrebalov, J., and Nasrallah, J.B. (1997). The self-incompatibility (S) haplotypes of Brassica contain highly divergent and rearranged sequences of ancient origin. Plant Cell 9 237–247. - PMC - PubMed
    1. Camargo, L.E.A., Savides, L., Jung, G., Nienhuis, J., and Osborn, T.C. (1997). Location of the self-incompatibility locus in an RFLP and RAPD map of Brassica oleracea. J. Hered. 88 57–60. - PubMed

Publication types

LinkOut - more resources