. 2000 Jan;12(1):65-80.
doi: 10.1105/tpc.12.1.65.

Expression profiling of the maize flavonoid pathway genes controlled by estradiol-inducible transcription factors CRC and P

Affiliations

Expression profiling of the maize flavonoid pathway genes controlled by estradiol-inducible transcription factors CRC and P

W Bruce et al. Plant Cell. 2000 Jan.

Abstract

To determine the scope of gene expression controlled by the maize transcription factors C1/R and P, which are responsible for activating flavonoid synthesis, we used GeneCalling, an open-ended, gel-based, mRNA-profiling technology, to analyze cell suspension lines of the maize inbred Black Mexican Sweet (BMS) that harbored estradiol-inducible versions of these factors. BMS cells were transformed with a continually expressed estrogen receptor/maize C1 activator domain fusion gene (ER-C1) and either a fusion of C1 and R (CRC), P, or luciferase genes regulated by a promoter containing four repeats of an estrogen receptor binding site. Increasing amounts of luciferase activity, anthocyanins, and flavan-4-ols were detected in the respective cell lines after the addition of estradiol. The expression of both known and novel genes was detected simultaneously in these BMS lines by profiling the mRNA isolated from replicate samples at 0, 6, and 24 hr after estradiol treatment. Numerous cDNA fragments were identified that showed a twofold or greater difference in abundance at 6 and 24 hr than at 0 hr. The cDNA fragments from the known flavonoid genes, except chalcone isomerase (chi1), were induced in the CRC-expressing line after hormone induction, whereas only the chalcone synthase (c2) and flavanone/dihydroflavonol reductase (a1) genes were induced in the P-expressing line, as was expected. Many novel cDNA fragments were also induced or repressed by lines expressing CRC alone, P alone, or both transcription factors in unique temporal patterns. The temporal differences and the evidence of repression indicate a more diverse set of regulatory controls by CRC or P than originally expected. GeneCalling analysis was successful in detecting members of complex metabolic pathways and uncovering novel genes that were either coincidentally regulated or directly involved in such pathways.


Figures
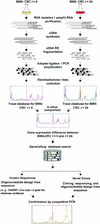
Figure 1.
Figure 1.
Schematic of the GeneCalling Analysis. Total RNA is extracted from the cell lines, and poly(A)+ RNA is purified and converted to cDNA, which is fragmented by using pairs of restriction enzymes (RE). Adapters are then ligated to the ends of the fragments, which are amplified by polymerase chain reaction (PCR). Because one of the PCR primers is labeled with a fluorescent tag (fluorescamine; FAM), amplified fragments can be visualized during electrophoresis. For each sample and restriction enzyme pair, electronic images of the gel lane traces are collected and kept in a sample trace database. Comparisons of the trace databases reveal specific expression differences that are characterized by the length of the amplified fragment and by restriction enzyme sequence information. The identity of each differentially expressed gene fragment can be established either by performing a GeneCalling search in a sequence database or by cloning and sequencing the desired cDNA fragment. The identity of the cDNA fragment is confirmed by competitive PCR in which the original PCR reaction is reamplified in the presence or absence of an excess of an unlabeled, gene-specific PCR primer. Further characterization of known and newly discovered sequences that are identified by GeneCalling analysis as differentially expressed can be obtained by BLASTX and BLASTN analyses against public and proprietary databases. t, time in hours.
Figure 2.
Figure 2.
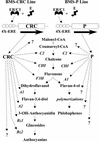
Schematic of the Estradiol-Inducible Anthocyanin and Phlobaphene Pathways. BMS cell lines harbor a constitutively expressed estrogen receptor–maize C1 activator domain fusion gene (ER/C1) that binds to estradiol (E) and in turn activates the expression of the P or CRC genes by way of 4X-ERE promoter. Members of the flavonoid pathway are then activated, generating anthocyanins or phlobaphenes. Other genes suspected to be regulated by P or CRC are designated by question marks. Genes known to be involved in the flavonoid pathway are designated as follows: C2, chalcone synthase; CHI, chalcone isomerase; F3H, flavanone 3-hydroxylase; A1, flavanone/dihydroflavanonol NADPH-dependent reductase; A2, proanthocyanidin synthase; Bz1, UDP-glucose:flavonoid 3-O-glucosyltransferase; Bz2, a glutathione S-transferase.
Figure 3.
Figure 3.
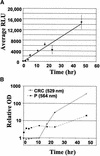
Estradiol-Induced Luciferase Activity and Accumulation of Anthocyanins and Flavan-4-ols in Transformed BMS Cell Lines. (A) Luciferase data are expressed as the mean relative light units (RLU) of three sample replicates from three independent samples for each time point, with error bars representing ±sd. (B) Accumulation of anthocyanins and flavan-4-ols was measured by spectral absorption at 529 and 564 nm, respectively, of extracts from three replicate samples. Note the log scale of absorption values. Standard deviation for each absorbance value was <15% of the mean value, except for the 4-hr samples from the CRC-expressing line, in which the standard deviation was 39% of the mean absorbance value.
Figure 4.
Figure 4.
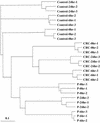
Hierachical Cluster Analysis of Gene Expression Profiles of BMS Cell Line Treatments and Replicates. Trace profiles for each replicate were compared with those for all the other replicates. The distances for clustered replicates were based on the Pearson's correlation coefficients for peak intensities of all the cDNA fragments within the corresponding traces. The dendogram showing the relatedness of samples was produced using PHYLIP (Felsenstein, 1989) and visualized using TREEVIEW (Page, 1996). formula image.
Figure 5.
Figure 5.
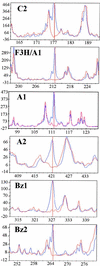
Induction of the Flavonoid Gene Fragments by CRC Measured at 24 Hr after Estradiol Treatment. Each panel shows the average gel trace based on six to nine replicate gels of digested gene fragments from the CRC-expressing BMS line at 24 hr (blue) and 0 hr (red) after estradiol treatment. Three replicates of three independent samples were analyzed by GeneCalling. The vertical red line indicates the gene fragment that corresponds to the confirmed gene product. The designations C2, A2, Bz1, and Bz2 are described in the legend to Figure 2. The designation F3H/A1 refers to cDNA fragments from the F3H and A1 genes with identical fragment size and restriction sites at the fragment ends. The y axis is in arbitrary fluorescence units, whereas the x axis is in base pairs of nucleotides.
Figure 6.
Figure 6.
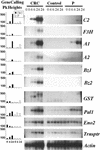
Comparison of GeneCalling and RNA Gel Blot Analyses for Several CRC- and P-Regulated Genes. The GeneCalling peak (Pk) height graphs indicate the maximal average peak height in arbitrary fluorescence units (y axis) for the cDNA fragment corresponding to each of the analyzed genes from each sampling time. The adjacent RNA gel blots show the signals obtained in hybridization by using ∼2 μg of poly(A)+ RNA. RNA gel blot analysis was performed on two independent replicates of the three BMS cell lines (CRC, Control, and P). The blots were hybridized with probes corresponding to C2, A1, A2, Bz1, Bz2, GST, pal1 (Rosler et al., 1997), eno2 (Lal et al., 1998), and Trnsptr (MRP transporter; Buchler et al., 1996). A maize actin cDNA clone acted as an RNA loading control. Hours after estradiol treatment are indicated for the x axis of the graphs and for each lane of the gel.
Figure 7.
Figure 7.
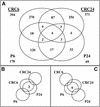
A Venn Diagram of Shared and Specific Differentially Expressed cDNA Fragments for All Treatments Analyzed. (A) The numbers of unique cDNA fragments for the majority of comparisons are shown. The cDNA fragments are either induced or repressed, with a more than twofold difference detected between 6 or 24 hr and 0 hr after initiating treatment, in the cell lines indicated. These fragments are either shared or unique to particular treatments. The values shown under each treatment name are the total number of unique cDNA fragments that showed differential expression for that treatment. (B) The number of cDNA fragments showing differences at 6 hr after treatment for CRC-expressing cells and at 24 hr after treatment for P-expressing cells versus their corresponding 0-hr values. (C) The number of cDNA fragments showing differences at 24 hr after treatment for CRC-expressing cells and at 6 hr after treatment for P-expressing cells versus their corresponding 0-hr values. The number of cDNA fragments with responses in agreement with that of the control BMS line was excluded.
Figure 8.
Figure 8.
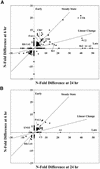
Temporal Correlation of cDNA Fragment N-Fold Difference Values for the CRC- and P-Expressing Lines. (A) Individual cDNA fragments from the CRC-expressing BMS line were plotted as their N-fold difference between the results for the 6-hr and 24-hr samples. The N-fold differences are the ratios of the average peak height values at either 24 or 6 hr after treatment to those at 0 hr for each cDNA fragment. Results for differences of less than twofold are not shown. (B) Individual cDNA fragments from the P-expressing BMS line were plotted as the N-fold difference in results between 6 hr and 24 hr after treatment. Early and Late refer to genes that are induced or repressed at either the 6- or 24-hr times only, respectively. Steady State refers to genes for which the differential expression at 6 hr remains the same at 24 hr, whereas Linear Change refers to those that are either induced or repressed in a linear manner from 6 hr to 24 hr. Some of the cDNA fragments corresponding to genes regulated by CRC or P are indicated as follows: CRC, the C1–R fusion gene; C2, A1, A2, Bz1, Bz2, and F3H (as in the legend to Figure 2); Pal1 and Eno2 (as in the legend to Figure 6); Rib L41, ribosomal protein L41; 3′ UTR, the poly(A) addition sequence from the potato PinII gene present in all of the clones introduced into the BMS cells.
Figure 9.
Figure 9.
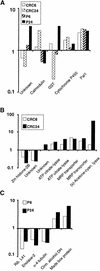
Differential Expression of Known and Newly Discovered Gene Fragments after Induction of CRC and P. (A) The N-fold differences for cDNA fragments affected by both CRC and P. The data are shown as the ratio of the average peak-height values from cDNA fragments at 6 or 24 hr after treatment initiation to the 0-hr value. (B) N-fold differences for cDNA fragments affected by CRC alone. (C) N-fold differences for cDNA fragments affected by P alone. The average peak-height values showed <15% variance over the mean of six to nine replicate gel analyses. Shown are the gene names from GenBank matching most closely the amino acid sequences of the corresponding cDNA fragments.

Similar articles

Cited by

References

    1. Alfenito, M.R., Souer, E., Goodman, C.D., Buell, R., Mol, J., Koes, R., and Walbot, V. (1998). Functional complementation of anthocyanin sequestration in the vacuole by widely divergent glutathione S-transferases. Plant Cell 10 1135–1149. - PMC - PubMed
    1. Ashton, A.R., Jenkins, C.L.D., and Whitfeld, P.R. (1994). Molecular cloning of two different cDNAs for maize acetyl-CoA carboxylase. Plant Mol. Biol. 24 35–49. - PubMed
    1. Avila, J., Nieto, C., Canas, L., Benito, M.J., and Paz-Ares, J. (1993). Petunia hybrida genes related to the maize regulatory C1 gene and to animal Myb proto-oncogenes. Plant J. 3 553–562. - PubMed
    1. Bachem, C.W., van der Hoeven, R.S., de Bruijn, S.M., Vreugdenhil, D., Zabeau, M., and Visser, R.G. (1996). Visualization of differential gene expression using a novel method of RNA fingerprinting based on AFLP: Analysis of gene expression during potato tuber development. Plant J. 9 745–753. - PubMed
    1. Bruce, W.B., Christensen, A.H., Klein, T., Fromm, M., and Quail, P.H. (1989). Photoregulation of a phytochrome gene promoter from oat transferred into rice by particle bombardment. Proc. Natl. Acad. Sci. USA 86 9692–9696. - PMC - PubMed

LinkOut - more resources