Water deficit triggers phospholipase D activity in the resurrection plant Craterostigma plantagineum
- PMID: 10634911
- PMCID: PMC140218
- DOI: 10.1105/tpc.12.1.111
Water deficit triggers phospholipase D activity in the resurrection plant Craterostigma plantagineum
Abstract
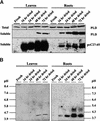
Phospholipids play an important role in many signaling pathways in animal cells. Signaling cascades are triggered by the activation of phospholipid cleaving enzymes such as phospholipases C, D (PLD), and A(2). Their activities result in the formation of second messengers and amplification of the initial signal. In this study, we provide experimental evidence that PLD is involved in the early events of dehydration in the resurrection plant Craterostigma plantagineum. The enzymatic activity of the PLD protein was activated within minutes after the onset of dehydration, and although it was not inducible by abscisic acid, PLD activity did increase in response to mastoparan, which suggests a role for heterotrimeric G proteins in PLD regulation. Two cDNA clones encoding PLDs, CpPLD-1 and CpPLD-2, were isolated. The CpPLD-1 transcript was constitutively expressed, whereas CpPLD-2 was induced by dehydration and abscisic acid. Immunological studies revealed changes in the subcellular localization of the PLD protein in response to dehydration. Taken together, the data on enzymatic activity as well as transcript and protein distributions allowed us to propose a role for PLD in the events leading to desiccation tolerance in C. plantagineum.
Figures


Similar articles
-
Two dehydration-inducible transcripts from the resurrection plant Craterostigma plantagineum encode interacting homeodomain-leucine zipper proteins.Plant J. 1998 Aug;15(3):413-21. doi: 10.1046/j.1365-313x.1998.00222.x. Plant J. 1998. PMID: 9750352
-
Analysis of cDNA clones encoding sucrose-phosphate synthase in relation to sugar interconversions associated with dehydration in the resurrection plant Craterostigma plantagineum Hochst.Plant Physiol. 1997 Sep;115(1):113-21. doi: 10.1104/pp.115.1.113. Plant Physiol. 1997. PMID: 9306694 Free PMC article.
-
Characterization of five novel dehydration-responsive homeodomain leucine zipper genes from the resurrection plant Craterostigma plantagineum.Plant Mol Biol. 2002 Aug;49(6):601-10. doi: 10.1023/a:1015501205303. Plant Mol Biol. 2002. PMID: 12081368
-
[The role of phospholipase D in cellular signaling].Zhi Wu Sheng Li Yu Fen Zi Sheng Wu Xue Xue Bao. 2005 Oct;31(5):451-60. Zhi Wu Sheng Li Yu Fen Zi Sheng Wu Xue Xue Bao. 2005. PMID: 16222086 Review. Chinese.
-
Phospholipase D in hormonal and stress signaling.Curr Opin Plant Biol. 2002 Oct;5(5):408-14. doi: 10.1016/s1369-5266(02)00283-2. Curr Opin Plant Biol. 2002. PMID: 12183179 Review.
Cited by
-
Long-chain bases, phosphatidic acid, MAPKs, and reactive oxygen species as nodal signal transducers in stress responses in Arabidopsis.Front Plant Sci. 2015 Feb 13;6:55. doi: 10.3389/fpls.2015.00055. eCollection 2015. Front Plant Sci. 2015. PMID: 25763001 Free PMC article.
-
Stress tolerance and glucose insensitive phenotypes in Arabidopsis overexpressing the CpMYB10 transcription factor gene.Plant Physiol. 2004 May;135(1):309-24. doi: 10.1104/pp.103.034199. Epub 2004 Apr 30. Plant Physiol. 2004. PMID: 15122027 Free PMC article.
-
Functional Characterization of the N-Terminal C2 Domain from Arabidopsis thaliana Phospholipase Dα and Dβ.Biomed Res Int. 2016;2016:2721719. doi: 10.1155/2016/2721719. Epub 2016 Dec 22. Biomed Res Int. 2016. PMID: 28101506 Free PMC article.
-
In vivo spectroscopy and NMR metabolite fingerprinting approaches to connect the dynamics of photosynthetic and metabolic phenotypes in resurrection plant Haberlea rhodopensis during desiccation and recovery.Front Plant Sci. 2015 Jul 21;6:564. doi: 10.3389/fpls.2015.00564. eCollection 2015. Front Plant Sci. 2015. PMID: 26257765 Free PMC article.
-
Genome-wide identification and expression analysis of phospholipase D gene in leaves of sorghum in response to abiotic stresses.Physiol Mol Biol Plants. 2022 Jun;28(6):1261-1276. doi: 10.1007/s12298-022-01200-9. Epub 2022 Jun 23. Physiol Mol Biol Plants. 2022. PMID: 35910446 Free PMC article.
References
-
- Altschul, S.F., Gish, W., Miller, W., Meyers, E.W., and Lipman, D.J. (1990). Basic local alignment search tool. J. Mol. Biol. 215 403–410. - PubMed
-
- Ausubel, F.M., Brent, R., Kingston, R.E., Moore, D.D., Seidman, J.G., Smith, J.A., and Struhl, K., eds (1996). Current Protocols in Molecular Biology. (New York: Wiley Interscience).
-
- Bartels, D., Schneider, K., Terstappen, G., Piatkowski, D., and Salamini, F. (1990). Molecular cloning of abscisic acid–modulated genes which are induced during desiccation of the resurrection plant Craterostigma plantagineum. Planta 181 27–34. - PubMed
-
- Bockel, C., Salamini, F., and Bartels, D. (1998). Isolation and characterization of genes expressed during early events of the dehydration process in the resurrection plant Craterostigma plantagineum. J. Plant Physiol. 152 158–168.
-
- Bonitta, D., and McCourt, P. (1998). Genetic analysis of ABA signal transduction pathways. Trends Plant Sci. 3 231–235.
Publication types
MeSH terms
Substances
LinkOut - more resources
Full Text Sources
Other Literature Sources

