. 2000 Jan 17;191(2):265-74.
doi: 10.1084/jem.191.2.265.

CC chemokine receptor (CCR)3/eotaxin is followed by CCR4/monocyte-derived chemokine in mediating pulmonary T helper lymphocyte type 2 recruitment after serial antigen challenge in vivo

Affiliations

CC chemokine receptor (CCR)3/eotaxin is followed by CCR4/monocyte-derived chemokine in mediating pulmonary T helper lymphocyte type 2 recruitment after serial antigen challenge in vivo

C M Lloyd et al. J Exp Med. .

Abstract

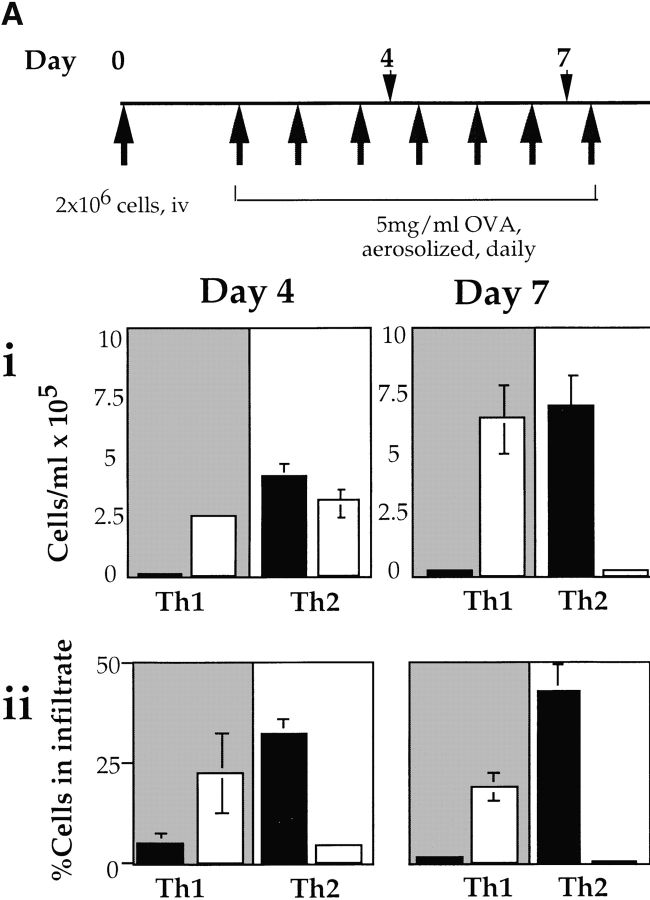
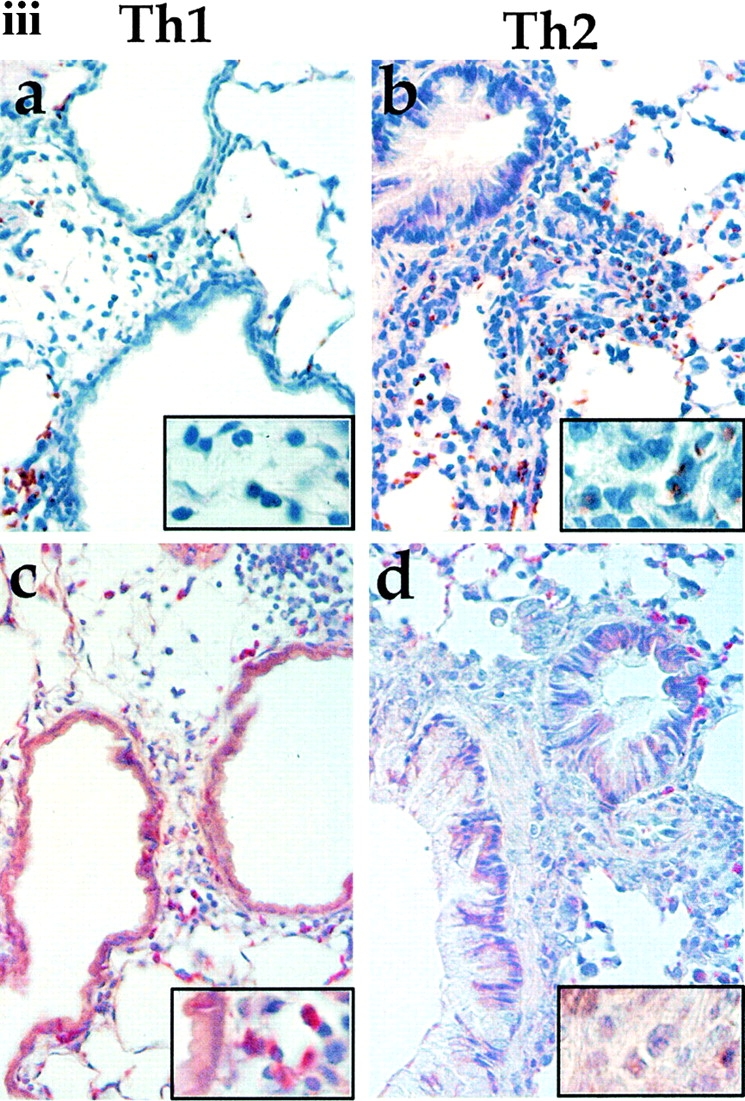
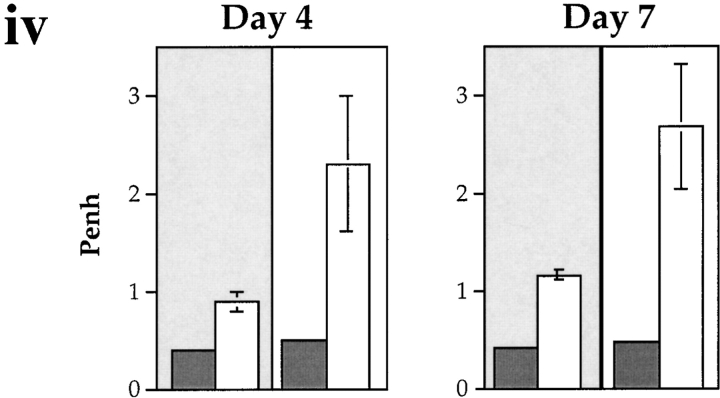
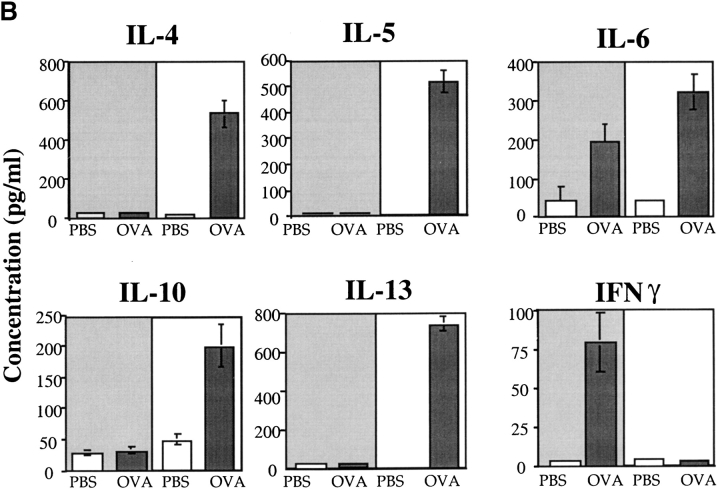
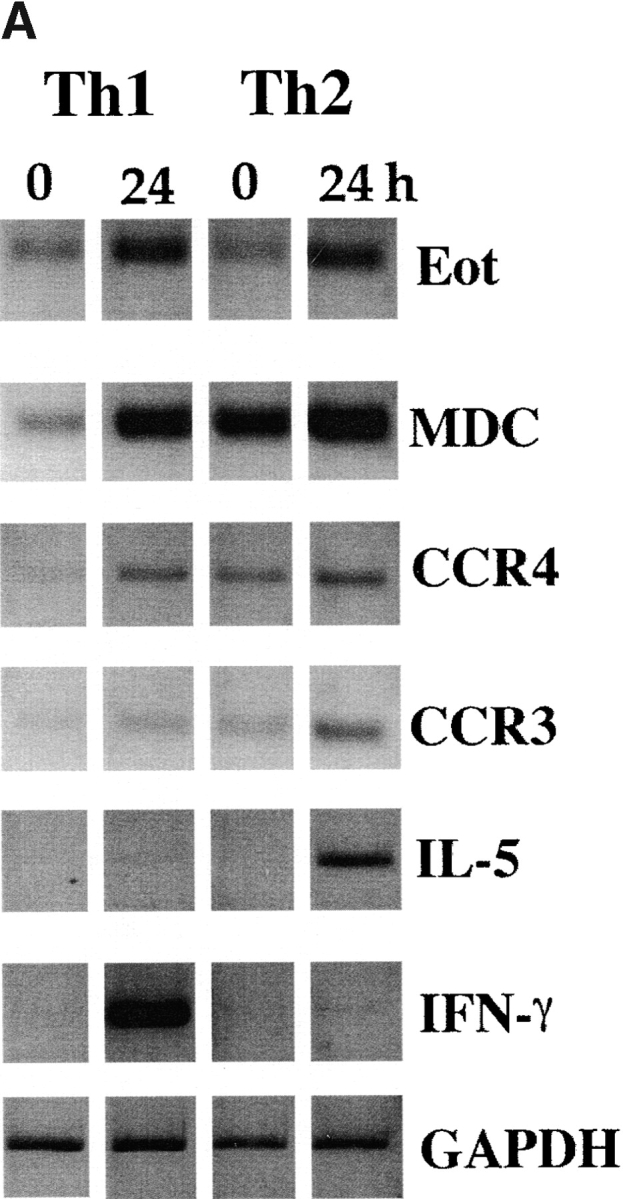
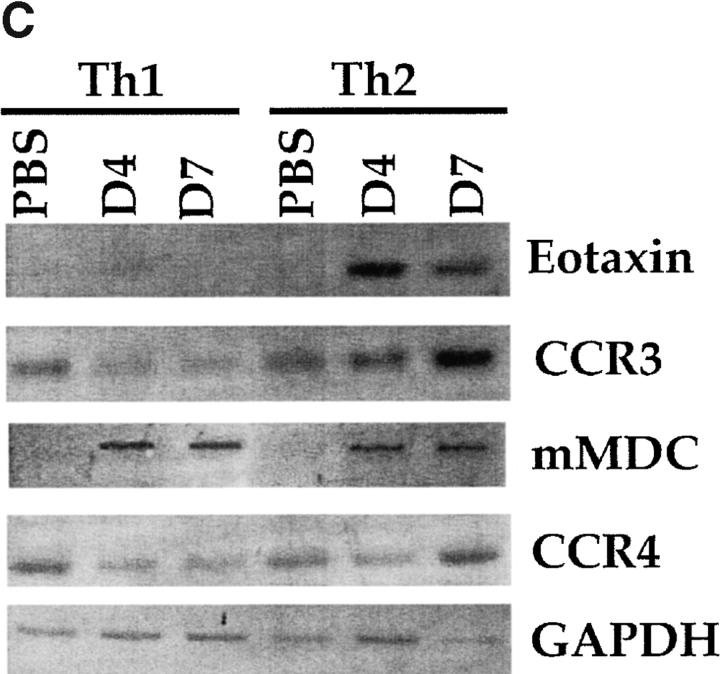
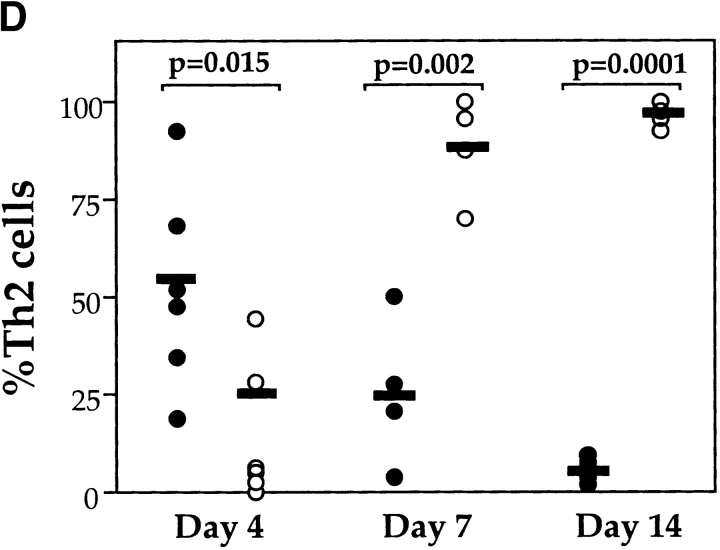
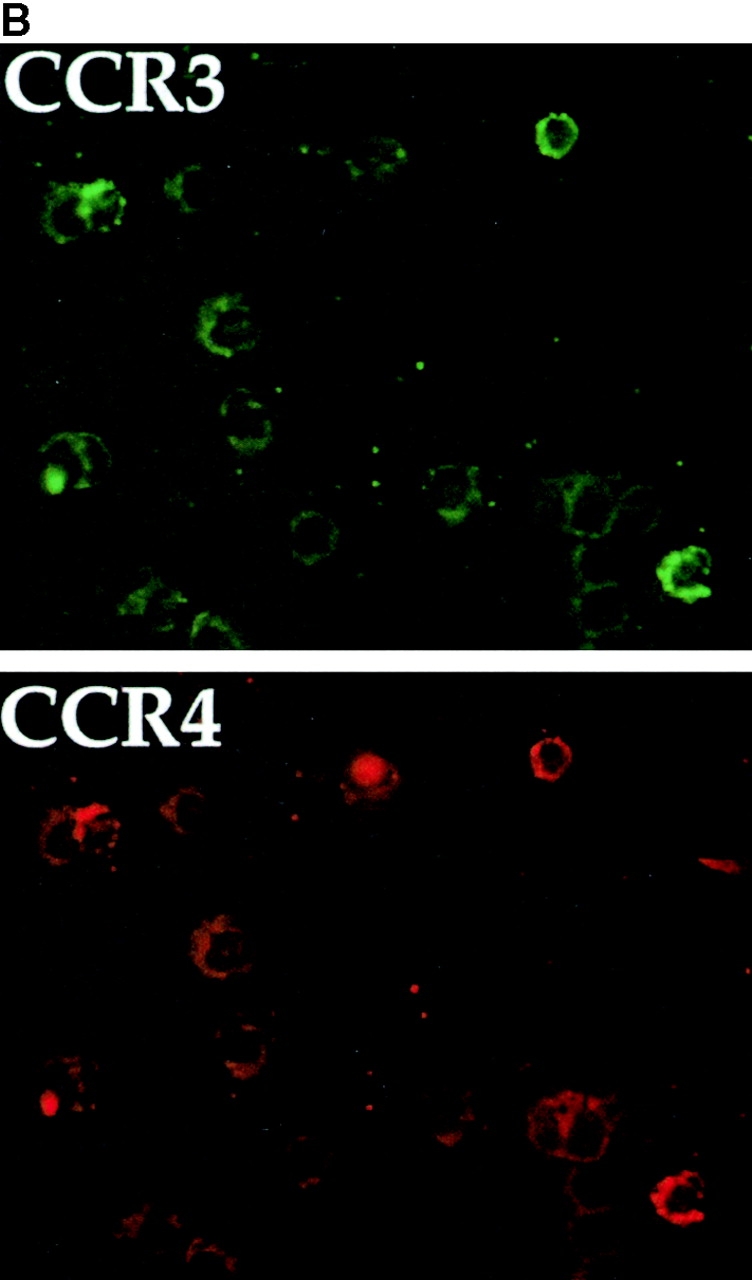
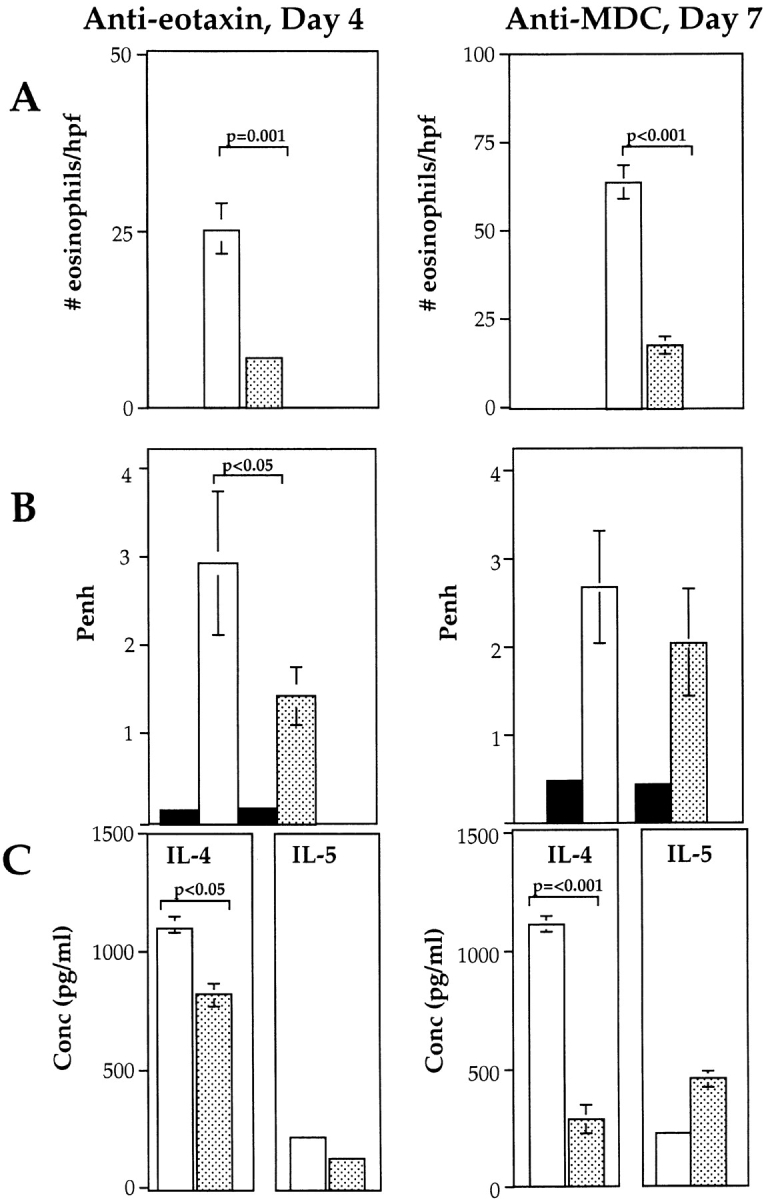
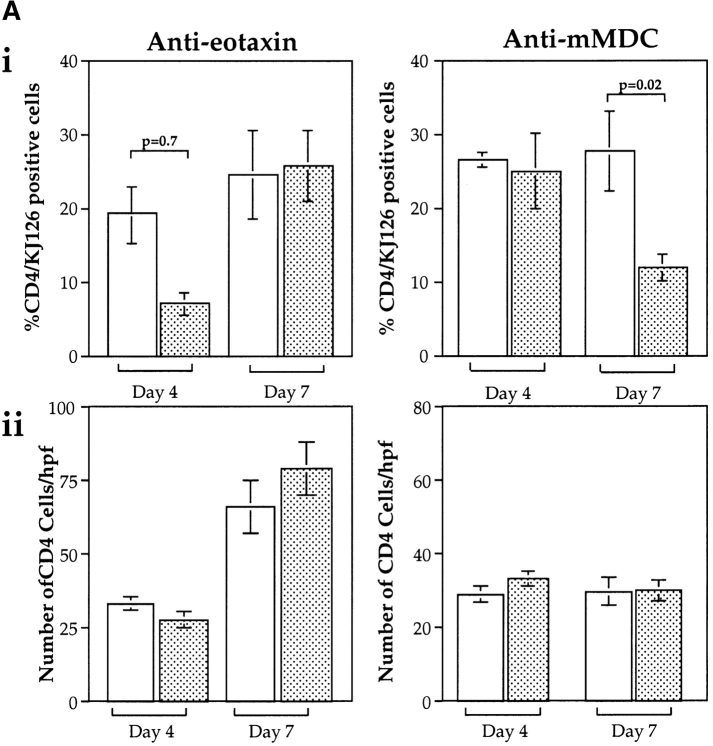
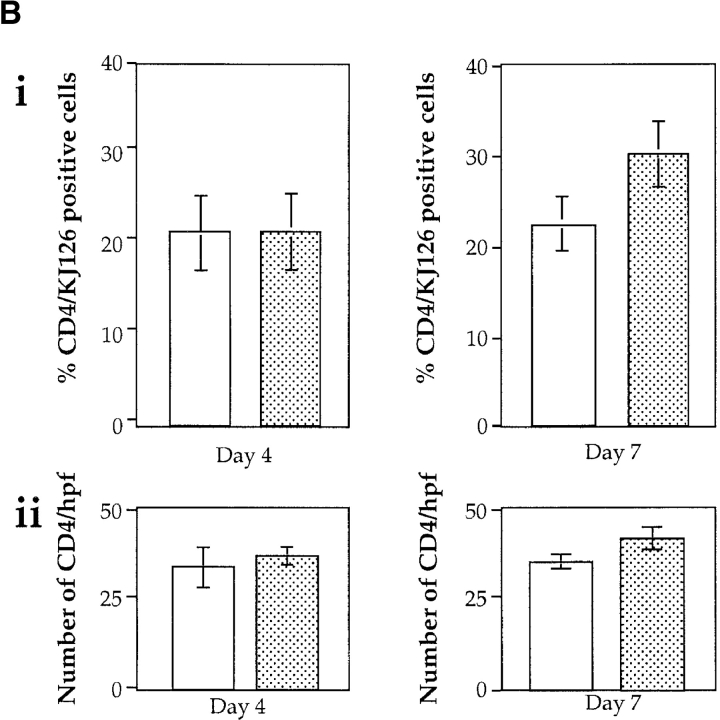
Isolated peripheral blood CD4 cells from allergic individuals express CC chemokine receptor (CCR)3 and CCR4 after expansion in vitro. In addition, human T helper type 2 (Th2) cells polarized in vitro selectively express CCR3 and CCR4 at certain stages of activation/differentiation and respond preferentially to the ligands eotaxin and monocyte-derived chemokine (MDC). However, controversy arises when the in vivo significance of this distinct expression is discussed. To address the functional role of CCR3/eotaxin and CCR4/MDC during the in vivo recruitment of Th2 cells, we have transferred effector Th cells into naive mice to induce allergic airway disease. Tracking of these cells after repeated antigen challenge has established that both CCR3/eotaxin and CCR4/MDC axes contribute to the recruitment of Th2 cells to the lung, demonstrating the in vivo relevance of the expression of these receptors on Th2 cells. We have shown that involvement of the CCR3/eotaxin pathway is confined to early stages of the response in vivo, whereas repeated antigen stimulation results in the predominant use of the CCR4/MDC pathway. We propose that effector Th2 cells respond to both CCR3/eotaxin and CCR4/MDC pathways initially, but that a progressive increase in CCR4-positive cells results in the predominance of the CCR4/MDC axis in the long-term recruitment of Th2 cells in vivo.


Figures

Figure 1
Figure 1
Adoptive transfer of Th effector cells leads to AAD. BALB/c mice were injected with 2 × 10⁶ cells followed by daily aerosolized OVA. Mice were killed on day 4 or 7 for analysis. Results shown are from two different experiments with five mice per group for each experiment. (A, i) Total leukocytes were recovered from BAL, counted, and cytospun, and differential counts were calculated. Total numbers of eosinophils (black bars) and neutrophils (white bars) are shown for days 4 (left) and 7 (right) after transfer of Th1 (gray background throughout figure) or Th2 cells (white background throughout figure). (A, ii) The percentage of eosinophils (black bars) and neutrophils (white bars) within peribronchiolar infiltrates was counted on days 4 (left) and 7 (right) after transfer of either Th1 or Th2 cells. (A, iii) Representative sections from mice transferred with Th1 cells (a and c) or Th2 cells (b and d) stained with eosinophil peroxidase (a and b) or chloroacetate esterase (c and d) to show the presence of eosinophils or neutrophils, respectively (original magnifications: ×400; [inset] ×1,000). (A, iv) BHR was measured after provocation with 20 mg/ml methacholine at days 4 and 7. Bars show mean P enh (± SEM) of groups of five mice before (gray bars) or after (white bars) methacholine stimulation. (B) BAL cytokines were measured by ELISA in OVA- (gray bars) and PBS-challenged mice (white bars) after transfer of Th1 (gray panel) or Th2 cells (white panel). Each bar represents the mean (± SEM) concentration in groups of five mice on day 4.
Figure 1
Figure 1
Adoptive transfer of Th effector cells leads to AAD. BALB/c mice were injected with 2 × 10⁶ cells followed by daily aerosolized OVA. Mice were killed on day 4 or 7 for analysis. Results shown are from two different experiments with five mice per group for each experiment. (A, i) Total leukocytes were recovered from BAL, counted, and cytospun, and differential counts were calculated. Total numbers of eosinophils (black bars) and neutrophils (white bars) are shown for days 4 (left) and 7 (right) after transfer of Th1 (gray background throughout figure) or Th2 cells (white background throughout figure). (A, ii) The percentage of eosinophils (black bars) and neutrophils (white bars) within peribronchiolar infiltrates was counted on days 4 (left) and 7 (right) after transfer of either Th1 or Th2 cells. (A, iii) Representative sections from mice transferred with Th1 cells (a and c) or Th2 cells (b and d) stained with eosinophil peroxidase (a and b) or chloroacetate esterase (c and d) to show the presence of eosinophils or neutrophils, respectively (original magnifications: ×400; [inset] ×1,000). (A, iv) BHR was measured after provocation with 20 mg/ml methacholine at days 4 and 7. Bars show mean P enh (± SEM) of groups of five mice before (gray bars) or after (white bars) methacholine stimulation. (B) BAL cytokines were measured by ELISA in OVA- (gray bars) and PBS-challenged mice (white bars) after transfer of Th1 (gray panel) or Th2 cells (white panel). Each bar represents the mean (± SEM) concentration in groups of five mice on day 4.
Figure 2
Figure 2
Chemokine receptor expression in donor Th cell populations, and in lungs after Th cell transfer. (A) Expression of chemokine receptors CCR3 and CCR4 and their respective ligands, eotaxin and MDC, were determined by PCR in effector Th cells after three rounds of polarization and activation with anti-CD3 Ab. Polarity of Th cells was checked by expression of IL-5 and IFN-γ in each population. (B) Protein expression of CCR3 and CCR4 was confirmed by immunohistochemical staining of cytospins prepared from third-round polarized cells. (C) Expression of chemokine receptors CCR3 and CCR4 and their respective ligands, eotaxin and MDC, was determined by PCR in lung RNA pooled from three mice transferred with either Th1 or Th2 cells and challenged with PBS or OVA. Levels were compared with those of the housekeeping gene, GAPDH. (D) Relative proportions of CCR3+ and CCR4+ Th2 cells in allergic lung tissue. CCR3- and CCR4-expressing Th2 cells were enumerated by locating an infiltrate in each KJ126-stained section and counting the percentage of KJ126-stained cells that were either CCR3+ or CCR4+ in serial sections. Sections were counted in lungs obtained at day 4 (n = 6), 7 (n = 4), or 14 (n = 5).
Figure 2
Figure 2
Chemokine receptor expression in donor Th cell populations, and in lungs after Th cell transfer. (A) Expression of chemokine receptors CCR3 and CCR4 and their respective ligands, eotaxin and MDC, were determined by PCR in effector Th cells after three rounds of polarization and activation with anti-CD3 Ab. Polarity of Th cells was checked by expression of IL-5 and IFN-γ in each population. (B) Protein expression of CCR3 and CCR4 was confirmed by immunohistochemical staining of cytospins prepared from third-round polarized cells. (C) Expression of chemokine receptors CCR3 and CCR4 and their respective ligands, eotaxin and MDC, was determined by PCR in lung RNA pooled from three mice transferred with either Th1 or Th2 cells and challenged with PBS or OVA. Levels were compared with those of the housekeeping gene, GAPDH. (D) Relative proportions of CCR3+ and CCR4+ Th2 cells in allergic lung tissue. CCR3- and CCR4-expressing Th2 cells were enumerated by locating an infiltrate in each KJ126-stained section and counting the percentage of KJ126-stained cells that were either CCR3+ or CCR4+ in serial sections. Sections were counted in lungs obtained at day 4 (n = 6), 7 (n = 4), or 14 (n = 5).
Figure 4
Figure 4
Decreased Th2 cell migration affects development of eosinophilia and BHR. The extent of eosinophilia (A), development of BHR (B), and levels of lavage cytokines (C) were determined in mice transferred with Th2 cells, challenged with OVA, and treated with neutralizing Abs to eotaxin (left) or MDC (right). Mice were given control Ab (white bars) and compared with Ab-treated mice (stippled bars). Numbers of eosinophils were counted in five hpf in cyanide-resistant, peroxidase-stained sections. BHR was measured as described in Materials and Methods and is shown as mean ± P enh for each group of mice after stimulation with methacholine (white and stippled bars) or at baseline (black bars). Levels of IL-4 and IL-5 in BAL were determined by ELISA, and are calculated as mean ± SEM for each group.
Figure 3
Figure 3
CCR3/eotaxin and CCR4/MDC function in a coordinated manner to promote Th2 cell recruitment in vivo. Numbers of total CD4 cells and antigen-specific donor Th cells were counted in mice treated with neutralizing Ab (stippled bars) or control Ab (white bars) after transfer of Th2 (A) or Th1 (B) cells. The percentage of antigen-specific cells was quantified by counting at least 250 CD4+ cells in each section, and then counting the number of KJ126+ cells in serial sections at a magnification of 400 for 10 mice in each group from two separate experiments (i). Total numbers of CD4+ cells per hpf are shown (ii).
Figure 3
Figure 3
CCR3/eotaxin and CCR4/MDC function in a coordinated manner to promote Th2 cell recruitment in vivo. Numbers of total CD4 cells and antigen-specific donor Th cells were counted in mice treated with neutralizing Ab (stippled bars) or control Ab (white bars) after transfer of Th2 (A) or Th1 (B) cells. The percentage of antigen-specific cells was quantified by counting at least 250 CD4+ cells in each section, and then counting the number of KJ126+ cells in serial sections at a magnification of 400 for 10 mice in each group from two separate experiments (i). Total numbers of CD4+ cells per hpf are shown (ii).

References

    1. Mossmann T.R., Coffman R.L. TH1 and TH2 cellsdifferent patterns of cytokine secretion lead to different functional properties. Annu. Rev. Immunol. 1989;7:145–173. - PubMed
    1. Xu D., Chan W.L., Leung B.P., Huang F.-P., Wheeler R., Piedrafita D., Robinson J.H., Liew F.Y. Selective expression of a stable cell surface molecule on type 2 but not type 1 helper T cells. J. Exp. Med. 1998;187:787–794. - PMC - PubMed
    1. Coyle, A.J., C. Lloyd, J. Tian, T. Nguyen, C. Eriksson, L. Wang, P. Ottoson, P. Persson, T. Delaney, S. Lehar, et al. Crucial role of the interleukin 1 receptor family member T1/ST2 in T helper cell type 2–mediated lung mucosal immune responses. 1999. J. Exp. Med. 190:895–902. - PMC - PubMed
    1. Mackay C.R. Chemokine receptors and T cell chemotaxis. J. Exp. Med. 1996;184:799–802. - PMC - PubMed
    1. Sallusto F., Mackay C.R., Lanzavecchia A. Selective expression of the eotaxin receptor CCR3 by human T helper 2 cells. Science. 1997;277:2005–2007. - PubMed

MeSH terms