Optimised ligation of oligonucleotides by thermal ligases: comparison of Thermus scotoductus and Rhodothermus marinus DNA ligases to other thermophilic ligases
- PMID: 10637340
- PMCID: PMC102565
- DOI: 10.1093/nar/28.3.e10
Optimised ligation of oligonucleotides by thermal ligases: comparison of Thermus scotoductus and Rhodothermus marinus DNA ligases to other thermophilic ligases
Abstract
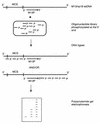
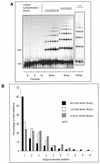
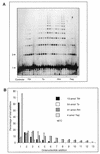
We describe the characterisation of four thermo-stable NAD(+)-dependent DNA ligases, from Thermus thermophilus (Tth), Thermus scotoductus (Ts), Rhodothermus marinus (Rm) and Thermus aquaticus (Taq), by an assay which measures ligation rate and mismatch discrimination. Complete libraries of octa-, nona- and decanucleotides were used as substrates. The assay comprised the polymerisation of oligo-nucleotides initiated from a 17 base 'primer', using M13mp18 ssDNA as template. Polymers of ligation products were analysed by polyacrylamide gel electro-phoresis. Under optimum conditions, the enzymes produced polymers ranging from 8 to 16 additions; there was variation between enzymes and the length of the oligonucleotides had a strong effect. The optimal total oligonucleotide concentration for each library was approximately 4 nmol. We compared the rates of ligation between the four ligases using an octanucleotide library as substrate. By this criterion, the Ts and Rm ligases are far more active compared to the more commonly available thermostable ligases.
Figures


Similar articles
-
Thermus scotoductus and Rhodothermus marinus DNA ligases have higher ligation efficiencies than thermus thermophilus DNA ligase.Anal Biochem. 2002 Mar 1;302(1):88-94. doi: 10.1006/abio.2001.5532. Anal Biochem. 2002. PMID: 11846380
-
Fidelity of DNA ligation: a novel experimental approach based on the polymerisation of libraries of oligonucleotides.Nucleic Acids Res. 1998 Sep 15;26(18):4259-66. doi: 10.1093/nar/26.18.4259. Nucleic Acids Res. 1998. PMID: 9722647 Free PMC article.
-
Biochemical properties of a high fidelity DNA ligase from Thermus species AK16D.Nucleic Acids Res. 1999 Feb 1;27(3):788-94. doi: 10.1093/nar/27.3.788. Nucleic Acids Res. 1999. PMID: 9889274 Free PMC article.
-
Functional biology and biotechnology of thermophilic viruses.Essays Biochem. 2023 Aug 11;67(4):671-684. doi: 10.1042/EBC20220209. Essays Biochem. 2023. PMID: 37222046 Free PMC article. Review.
-
Implications for the ligase chain reaction in gastroenterology.J Clin Gastroenterol. 1993 Sep;17(2):171-5. doi: 10.1097/00004836-199309000-00018. J Clin Gastroenterol. 1993. PMID: 8409324 Review.
Cited by
-
Scarless assembly of unphosphorylated DNA fragments with a simplified DATEL method.Bioengineered. 2017 May 4;8(3):296-301. doi: 10.1080/21655979.2017.1308986. Bioengineered. 2017. PMID: 28384080 Free PMC article.
-
Enzymatic repair of an expanded genetic information system.Nucleic Acids Res. 2003 Sep 1;31(17):5048-53. doi: 10.1093/nar/gkg709. Nucleic Acids Res. 2003. PMID: 12930955 Free PMC article.
-
Thermostable DNA ligases from hyperthermophiles in biotechnology.Front Microbiol. 2023 May 24;14:1198784. doi: 10.3389/fmicb.2023.1198784. eCollection 2023. Front Microbiol. 2023. PMID: 37293226 Free PMC article. Review.
-
TAC-seq: targeted DNA and RNA sequencing for precise biomarker molecule counting.NPJ Genom Med. 2018 Dec 18;3:34. doi: 10.1038/s41525-018-0072-5. eCollection 2018. NPJ Genom Med. 2018. PMID: 30588329 Free PMC article.
-
Rhodothermus marinus: physiology and molecular biology.Extremophiles. 2006 Feb;10(1):1-16. doi: 10.1007/s00792-005-0466-z. Epub 2005 Aug 2. Extremophiles. 2006. PMID: 16075163 Review.
References
-
- Waga S. and Stillman,B. (1998) Annu. Rev. Biochem., 67, 721–751. - PubMed
-
- Tomkinson A.E. and Levin,D.S. (1997) Bioessays, 19, 893–901. - PubMed
-
- Landegren U., Kaiser,R., Sanders,J. and Hood,L. (1988) Science, 241, 1077–1080. - PubMed
-
- Baron H., Fung,S., Aydin,A., Bahring,S., Luft,F.C. and Schuster,H. (1996) Nature Biotechnol., 14, 1279–1282. - PubMed
Publication types
MeSH terms
Substances
LinkOut - more resources
Full Text Sources
Other Literature Sources

