. 2000 Jan 15;522 Pt 2(Pt 2):187-98.
doi: 10.1111/j.1469-7793.2000.00187.x.

The 4'lysine in the putative channel lining domain affects desensitization but not the single-channel conductance of recombinant homomeric 5-HT3A receptors

Affiliations

The 4'lysine in the putative channel lining domain affects desensitization but not the single-channel conductance of recombinant homomeric 5-HT3A receptors

M J Gunthorpe et al. J Physiol. .

Abstract

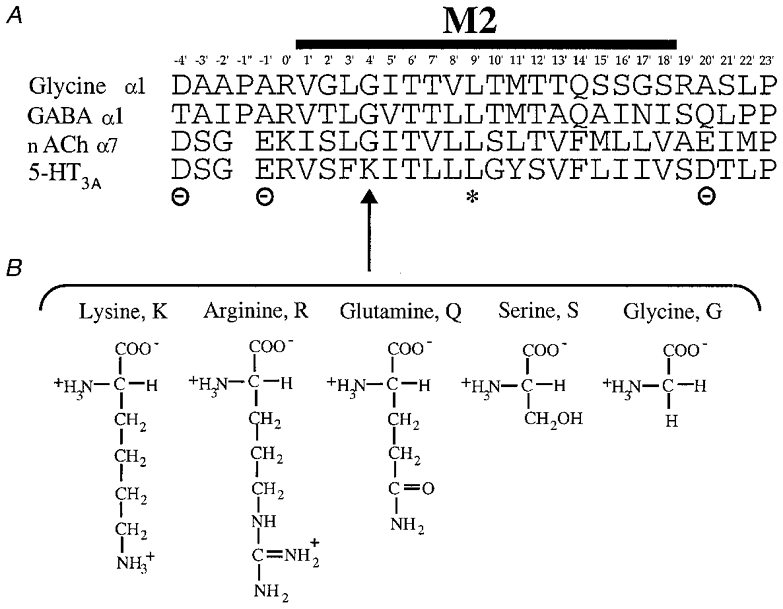
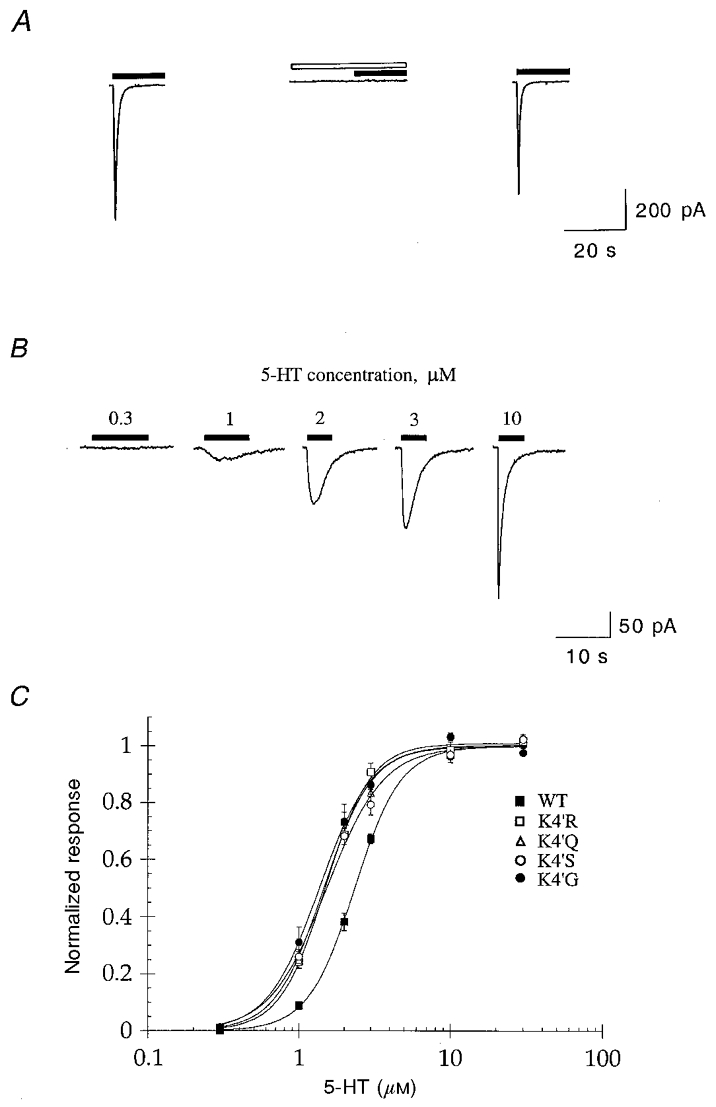
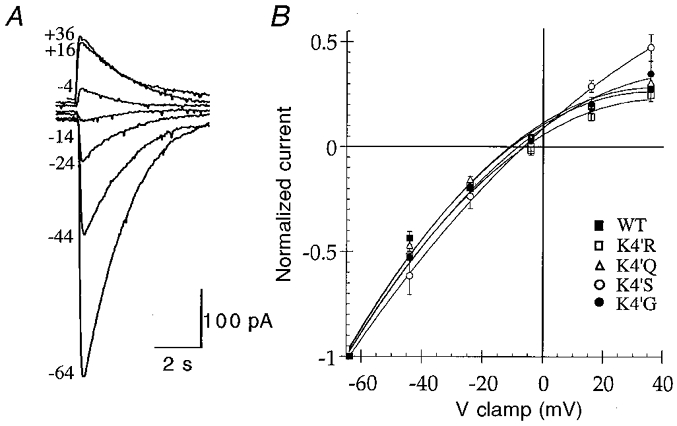
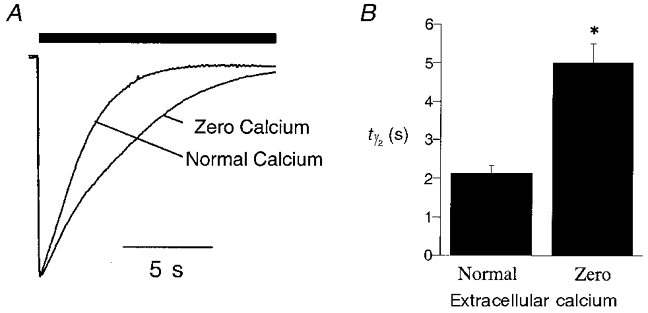
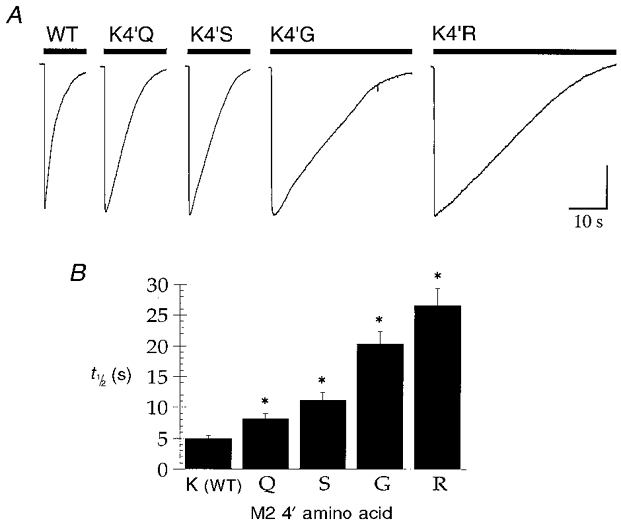
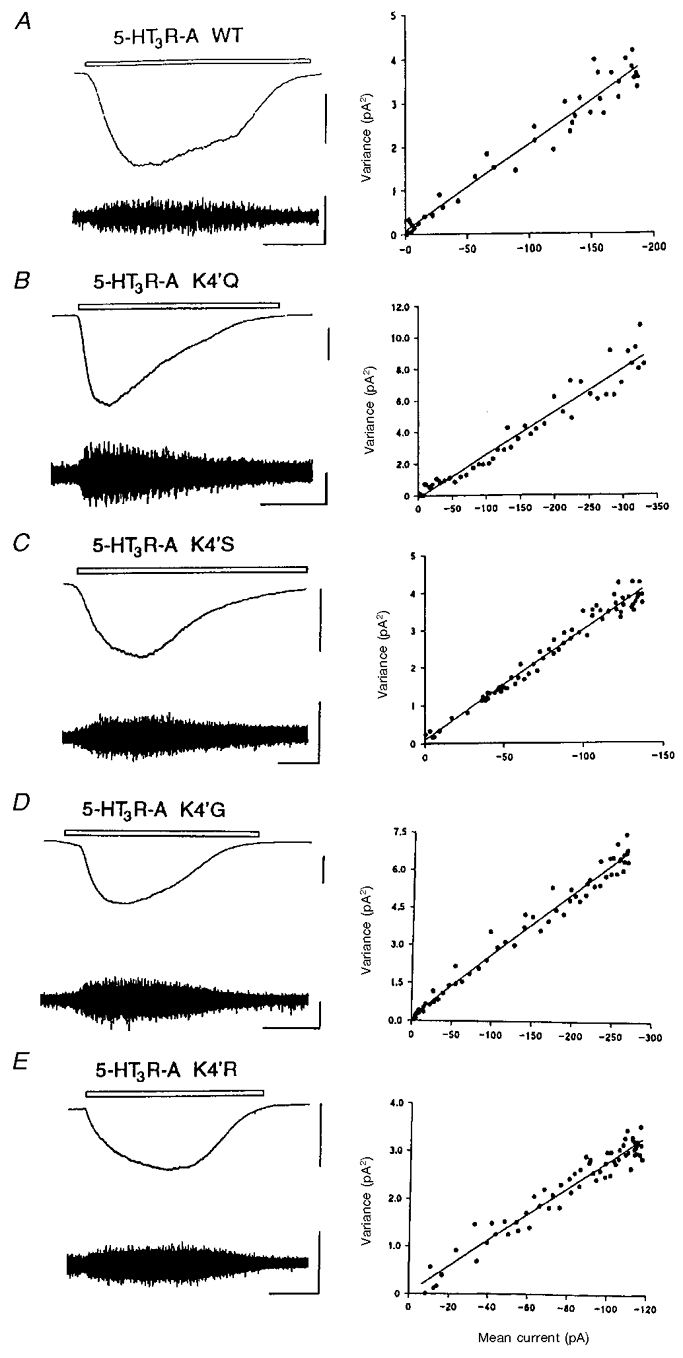
The 5-HT3 receptor is a transmitter-gated ion channel of the Cys-loop superfamily. Uniquely, 5-HT3 receptor subunits (5-HT3A and 5-HT3B) possess a positively charged lysine residue within the putative channel lining M2 domain (4' position). Using whole cell recording techniques, we examined the role of this residue in receptor function using wild-type (WT) and mutant 5-HT3A receptor subunits of murine origin transiently expressed in human embryonic kidney (HEK 293) cells. WT 5-HT3A receptors mediated rapidly activating currents in response to 5-HT (10-90 % rise time, 103 ms; EC50, 2.34 microM; Hill coefficient, nH, 2.87). The currents rectified inwardly, reversed in sign at a potential of -9 mV and desensitized in the continuous presence of agonist (half-time of desensitization, t(1/2), 2.13 s). 5-HT3A receptor subunits in which the 4'lysine was mutated to arginine, glutamine, serine or glycine formed functional receptors. 5-HT EC50 values were approximately 2-fold lower than for WT 5-HT3A receptors, but Hill coefficients, kinetics of current activation, rectification, and reversal potentials were unaltered. Each of the mutants desensitized more slowly than the WT 5-HT3A receptor, with the arginine and glycine mutations exhibiting the greatest effect (5-fold reduction). The rank order of effect was arginine > glycine > serine > glutamine. The single-channel conductance of the WT 5-HT3A receptor, as assessed by fluctuation analysis of macroscopic currents, was 390 fS. A similar value was obtained for the 4'lysine mutant receptors. Thus it appears unlikely that 4'lysine is exposed to the channel lumen. Mutation of residues immediately adjacent to 4'lysine to glutamate or lysine resulted in lack of receptor expression or function. We conclude that 4'lysine does not form part of the channel lining, but may play an important role in 5-HT3 receptor desensitization.


Figures

Figure 1
Figure 1. Alignment of various transmitter-gated ion channel M2 regions
A, the amino acid sequence (single letter code) of the M2 region of the murine 5-HT3A receptor (Maricq et al. 1991) is shown aligned with the corresponding regions of the glycine (α1, Grenningloh et al. 1987) GABAA (α1, Schofield et al. 1987) and nACh (α7, Couturier et al. 1990) receptors. The asterisk indicates the position of the conserved leucine (9′L) residue involved in channel gating (Filatov & White, 1995; Labarca et al. 1995). The positions of the cytoplasmic (–4′), intermediate (–1′) and extracellular (20′) rings of charged residues bordering M2 in the cationic channels are also indicated. B, the amino acids substituted for 4′lysine (4′K, arrow) in this study: arginine (R), glutamine (Q), serine (S) and glycine (G) shown to illustrate the differences in their side chain charge and length.
Figure 2
Figure 2. Dose-response curves for WT and 4′K mutant 5-HT3A receptors
A, whole cell currents evoked by 10 μm 5-HT in transfected HEK 293 cells (filled bars) were completely and reversibly inhibited by 10 nM granisetron (open bar). Traces are from one experiment and are representative of four others. No responses were detected in untransfected cells (not shown). B, sample traces showing 5-HT-evoked (0.3-10 μm) whole cell currents in a HEK 293 cell expressing the WT 5-HT3A receptor. Traces are from one experiment and are representative of four others. C, 5-HT dose-response curves for WT, and 4′K mutant 5-HT3 receptors (n = 4). Data from each cell were normalized to the Imax value obtained from the Hill equation. The data obtained from these experiments are summarized in Table 1.
Figure 3
Figure 3. Current-voltage relationships for WT and 4′K mutant 5-HT3A receptors
A, sample traces for current-voltage experiments conducted on the WT 5-HT3A receptor. 5-HT-evoked (10 μm, 2 s) whole cell responses were recorded at the holding potentials indicated to the left (mV). Traces are from one experiment and are representative of four others. B, I–V curves for WT and 4′K mutant 5-HT3A receptors were constructed by measuring the peak inward current evoked by 10 μm 5-HT, at the holding potentials (mV) shown (n = 4). The reversal potentials estimated from these data are given in Table 1.
Figure 4
Figure 4. Effect of extracellular Ca2+ on desensitization of the 5-HT3A receptor
The rate of desensitization of WT receptor whole cell currents was studied in ‘normal’ (E1; 1.8 mM calcium) or ‘zero’ calcium (∼10 nM) extracellular solutions (see Methods). A, sample traces showing the effect of extracellular Ca2+ on the rate of desensitization of WT receptor whole cell currents in the continued presence of a maximal concentration of agonist (30 μm 5-HT, filled bar). B, graph illustrating the difference in the rate of desensitization of whole cell current recorded in ‘normal’ or ‘zero’ extracellular Ca2+. The data represent the time taken for the current to decay to half of its peak value in the continued presence of agonist (i.e. half-time of desensitization, t1/2; n = 10–12). *Statistically different from responses evoked in normal extracellular solution (P < 0.05).
Figure 5
Figure 5. 4′K mutants desensitize more slowly than the WT 5-HT3A receptor
A, sample traces from experiments to estimate the rate of desensitization of WT and 4′K mutant receptors. Currents were evoked by application of a maximal concentration of 5-HT (30 μm, filled bar) to cells expressing WT or mutant receptors. Experiments were conducted in ‘zero’ Ca2+ extracellular solution (see Methods). The sample traces shown are from single experiments and are representative of 10–12 similar experiments. The vertical calibration bar corresponds to 200, 900, 550, 430 and 450 pA for WT, K4′Q, K4′S, K4′G and K4′R, respectively. B, graph summarizing the results of experiments to quantify the effect of 4′K substitutions upon 5-HT3A receptor desensitization. The data represent the time taken for the current to decay to half of its peak value in the continued presence of agonist (i.e. half-time of desensitization, t1/2; n = 10–12).
Figure 6
Figure 6. Estimation of the single-channel conductance of the WT and 4′K mutant 5-HT3A receptors
Examples from single cells of low-gain DC-coupled records (top left trace in each panel) and high-gain AC-coupled (1–1000 Hz bandwidth) records (bottom left trace in each panel) of inward currents evoked by application of 1 μm 5-HT applied by microperfusion for the period indicated (open bar) to HEK 293 cells expressing WT (A), K4′Q (B), K4′S (C), K4′G (D) and K4′R (E) 5-HT3 receptors. The vertical scale bars represent 100 and 5 pA for the DC- and AC-coupled traces, respectively. The horizontal calibration bar represents 20 s. The holding potential in all experiments was −60 mV. In each case the right panel represents the relationship between the variance of the AC-coupled current (pA2, vertical axes) and the DC amplitude (pA, horizontal axes) throughout the 5-HT-evoked response after background current variance in the absence of 5-HT has been subtracted. The slope of the line fitted to the data points, by linear regression analysis, provides an estimate of the underlying unitary conductance. In the examples shown above, the single-channel conductance (γ) was estimated to be 346, 473, 509, 428 and 484 fS for the WT, K4′Q, K4′S, K4′G and K4′R receptors, respectively.

Similar articles

Cited by

References

    1. Akabas MH, Kaufmann C, Archdeacon P, Karlin A. Identification of acetylcholine receptor channel-lining residues in the entire M2 segment of the α-subunit. Neuron. 1994;13:919–927. - PubMed
    1. Barnard EA. The transmitter-gated channels: a range of receptor types and structures. Trends in Pharmacological Sciences. 1996;17:305–309. - PubMed
    1. Barry PH, Lynch JW. Liquid junction potentials and small cell effects in patch-clamp analysis. Journal of Membrane Biology. 1991;121:101–117. - PubMed
    1. Belelli D, Balcarek JM, Hope AG, Peters JA, Lambert JJ, Blackburn TP. Cloning and functional expression of a human 5-hydroxytryptamine type 3AS receptor subunit. Molecular Pharmacology. 1995;48:1054–1062. - PubMed
    1. Boddeke HW, Meigel I, Boeijinga P, Arbuckle J, Docherty RJ. Modulation by calcineurin of 5-HT3 receptor function on NG108–15 neuroblastoma × glioma cells. British Journal of Pharmacology. 1996;118:1836–1840. - PMC - PubMed

Publication types

MeSH terms

LinkOut - more resources