. 2000 Jan 15;522 Pt 2(Pt 2):259-70.
doi: 10.1111/j.1469-7793.2000.t01-2-00259.x.

Modulation of CICR has no maintained effect on systolic Ca2+: simultaneous measurements of sarcoplasmic reticulum and sarcolemmal Ca2+ fluxes in rat ventricular myocytes

Affiliations

Modulation of CICR has no maintained effect on systolic Ca2+: simultaneous measurements of sarcoplasmic reticulum and sarcolemmal Ca2+ fluxes in rat ventricular myocytes

A W Trafford et al. J Physiol. .

Abstract

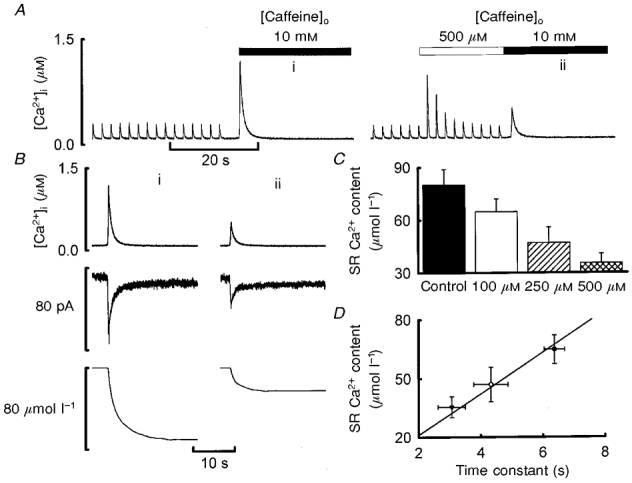
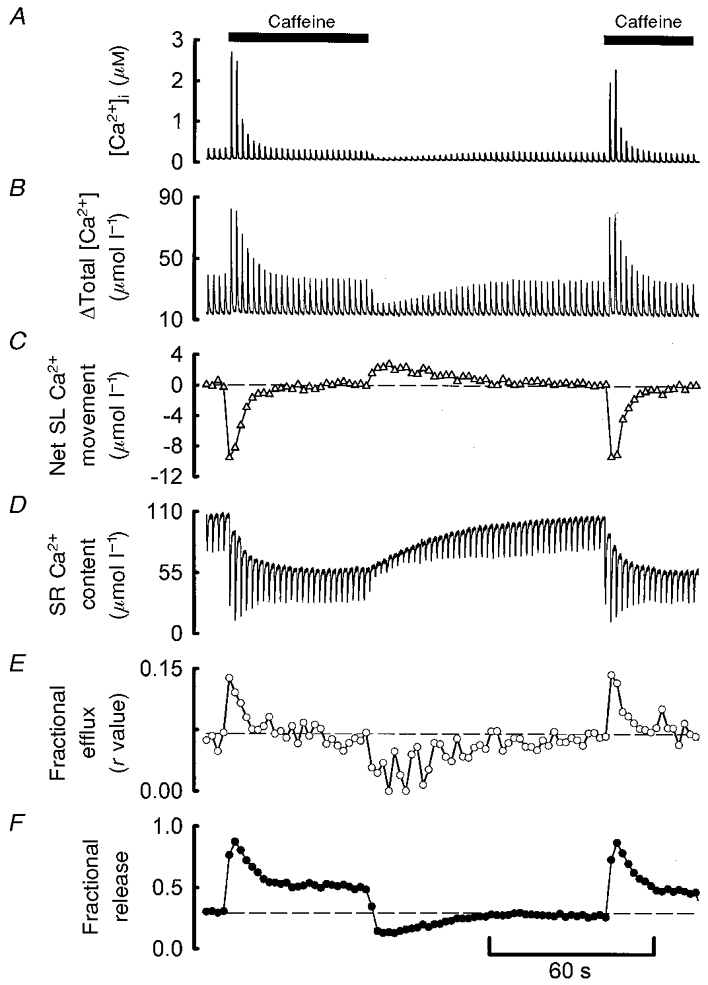
1. The effects of modulating Ca2+-induced Ca2+ release (CICR) in single cardiac myocytes were investigated using low concentrations of caffeine (< 500 microM) in reduced external Ca2+ (0.5 mM). Caffeine produced a transient potentiation of systolic [Ca2+]i (to 800 % of control) which decayed back to control levels. 2. Caffeine decreased the steady-state sarcoplasmic reticulum (SR) Ca2+ content. As the concentration of caffeine was increased, both the potentiation of the systolic Ca2+ transient and the decrease in SR Ca2+ content were increased. At higher concentrations, the potentiating effect decayed more rapidly but the rate of recovery on removal of caffeine was unaffected. 3. A simple model in which caffeine produces a fixed increase in the fraction of SR Ca2+ which is released could account qualitatively but not quantitatively for the above results. 4. The changes in total [Ca2+] during systole were obtained using measurements of the intracellular Ca2+ buffering power. Caffeine initially increased the fractional release of SR Ca2+. This was followed by a decrease to a level greater than that under control conditions. The fraction of systolic Ca2+ which was pumped out of the cell increased abruptly upon caffeine application but then recovered back to control levels. The increase in fractional loss is due to the fact that, as the cytoplasmic buffers become saturated, a given increase in systolic total [Ca2+] produces a larger increase in free [Ca2+] and thence of Ca2+ efflux. 5. These results confirm that modulation of the ryanodine receptor has no maintained effect on systolic Ca2+ and show the interdependence of SR Ca2+ content, cytoplasmic Ca2+ buffering and sarcolemmal Ca2+ fluxes. Such analysis is important for understanding the cellular basis of inotropic interventions in cardiac muscle.


Figures

Figure 1
Figure 1. The effects of caffeine on the amplitude and time course of systolic [Ca2+]i
A, fluo-3 measurements of [Ca2+]i. The membrane potential was held at −40 mV and 100 ms duration depolarising pulses were applied to 0 mV at 0.5 Hz. Caffeine (500 μm) was applied for the periods shown by the filled bars. B, specimen transients obtained at the points indicated in A. The transient labelled ii is a single record whereas those labelled i and iii are averages of 5. C, left: superimposed (not normalised) records of transients i (continuous trace) and iii (dotted trace). Right: transients i and ii normalised to the same peak level.
Figure 2
Figure 2. The effects of different concentrations of caffeine on systolic [Ca2+]i
A, original records showing the effects of applying the indicated concentrations of caffeine for the periods shown. In this experiment the cells were field stimulated rather than voltage clamped. B, time course of change in the amplitude of the systolic Ca2+ transient (^). The continuous curves are first order exponentials fitted to the data with the indicated rate constants. C, histograms showing the relationship between caffeine concentration and various parameters. a, peak Ca2+ transient amplitude in caffeine divided by control; b, steady-state amplitude in caffeine divided by the amplitude of the smallest transient in the undershoot; c, rate constant of decay of potentiation in caffeine divided by the rate constant of recovery on removal of caffeine. Values are means ±s.e.m. for 9 experiments.
Figure 3
Figure 3. The effects of caffeine (100–500 μm) on SR Ca2+ content
A, time course. In both parts of the record shown, the cell was first stimulated with 100 ms duration depolarising pulses from −40 to 0 mV at 0.5 Hz. Stimulation was then stopped and 10 mm caffeine applied (filled bar). In the right-hand record, 500 μm caffeine (open bar) was applied for the period shown before addition of 10 mm caffeine. B, measurement of SR Ca2+ content. Traces show (from top to bottom): [Ca2+]i, membrane current, integrated current. The records were obtained from the applications of 10 mm caffeine indicated in A. C, mean data showing the effects of different concentrations of caffeine on SR Ca2+ content. Values are means ±s.e.m. (n = 5 for all concentrations). D, graph of SR Ca2+ content as a function of the time constant of decay of the caffeine-evoked potentiation (see Fig. 2). Each symbol is from a different caffeine concentration (from left to right: 500, 250 and 100 μm).
Figure 4
Figure 4. Measurements of total and free cytoplasmic Ca2+ transients, SR Ca2+ content and sarcolemmal Ca2+ fluxes
A, time course. Caffeine (500 μm) was applied for the period shown. B, specimen records taken from the transients indicated in A. a, [Ca2+]i; b, membrane current (Im); c, calculated sarcolemmal (SL) fluxes; d, total Ca2+ transients; e, calculated change in SR Ca2+ content.
Figure 5
Figure 5. Pulse-by-pulse analysis of sarcolemmal and SR Ca2+ fluxes
A, [Ca2+]i. B, total cytoplasmic [Ca2+]. C, net sarcolemmal Ca2+ flux calculated from Ca2+ entry on the L-type Ca2+ current and efflux on Na+-Ca2+ exchange. The dashed line represents zero net flux. D, SR Ca2+ content. E, fractional efflux (r in model) calculated as: Ca2+ efflux/amplitude of the total Ca2+ transient. F, fractional SR Ca2+ release (f in model) calculated as: (diastolic – systolic SR Ca2+ content)/diastolic SR Ca2+ content.
Figure 6
Figure 6. Interdependence of SR Ca2+ content, total [Ca2+], [Ca2+]i and Ca2+ efflux
A, Ca2+ buffering curve. This was obtained from the application of 10 mm caffeine. Total [Ca2+] is plotted as a function of [Ca2+]i. The continuous line through the data shows the fit to the data with maximal binding (Bmax) = 97 μmol l−1 and Kd= 0.49 μm. B, dependence of total [Ca2+] (•) and [Ca2+]i (^) on SR Ca2+ content. The curves through the data points have been fitted with the relationship: b+a(SR Ca2+ content)n (see text). The value of the exponent n for the total [Ca2+] relationship (continuous line) is 2.1 whilst that for the free [Ca2+] relationship (dashed line) is 5.7. C, Ca2+ efflux, calculated from the Na+-Ca2+ exchange currents on repolarisation, as a function of total [Ca2+] during caffeine application (▪) and upon caffeine washout (□). The value of the exponent for the curve fitted to the data is 1.6. D, Ca2+ efflux as a function of [Ca2+]i during caffeine application (▴) and upon caffeine washout (▵). The continuous line represents the best fit to the data with Vmax= 15.2 μmol l−1 and Km= 1.4 μm. The horizontal dashed line shows the Ca2+ influx on the L-type Ca2+ current. All the data were obtained from the same cell shown in Fig. 5. Data in B-D were taken from the period of the first caffeine application shown in Fig. 5A.

References

    1. Adams WA, Trafford AW, Eisner DA. 2,3-Butanedione monoxime (BDM) decreases sarcoplasmic reticulum Ca content by stimulating Ca release in isolated rat ventricular myocytes. Pflügers Archiv. 1998;436:776–781. - PubMed
    1. Bassani JWM, Yuan W, Bers DM. Fractional SR Ca release is regulated by trigger Ca and SR Ca content in cardiac myocytes. American Journal of Physiology. 1995;268:C1313–1329. - PubMed
    1. Berlin JR, Bassani JWM, Bers DM. Intrinsic cytosolic calcium buffering properties of single rat cardiac myocytes. Biophysical Journal. 1994;67:1775–1787. - PMC - PubMed
    1. Bers DM, Berlin JR. Kinetics of [Ca2+]i decline in cardiac myocytes depend on peak [Ca2+]i. American Journal of Physiology. 1995;268:C271–277. - PubMed
    1. Bers DM, Bridge JH, Macleod KT. The mechanism of ryanodine action in rabbit ventricular muscle evaluated with Ca-selective microelectrodes and rapid cooling contractures. Canadian Journal of Physiology and Pharmacology. 1987;65:610–618. - PubMed

Publication types

MeSH terms

LinkOut - more resources