

Landscape approaches for determining the ensemble of folding transition states: success and failure hinge on the degree of frustration
- PMID: 10639131
- PMCID: PMC15382
- DOI: 10.1073/pnas.97.2.634
Landscape approaches for determining the ensemble of folding transition states: success and failure hinge on the degree of frustration
Abstract
We present a method for determining structural properties of the ensemble of folding transition states from protein simulations. This method relies on thermodynamic quantities (free energies as a function of global reaction coordinates, such as the percentage of native contacts) and not on "kinetic" measurements (rates, transmission coefficients, complete trajectories); consequently, it requires fewer computational resources compared with other approaches, making it more suited to large and complex models. We explain the theoretical framework that underlies this method and use it to clarify the connection between the experimentally determined Phi value, a quantity determined by the ratio of rate and stability changes due to point mutations, and the average structure of the transition state ensemble. To determine the accuracy of this thermodynamic approach, we apply it to minimalist protein models and compare these results with the ones obtained by using the standard experimental procedure for determining Phi values. We show that the accuracy of both methods depends sensitively on the amount of frustration. In particular, the results are similar when applied to models with minimal amounts of frustration, characteristic of rapid-folding, single-domain globular proteins.
Figures
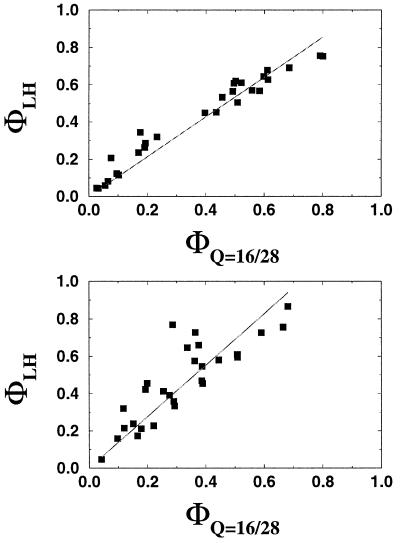
 −RT
ln(kmut/kwt)/ΔΔG0.
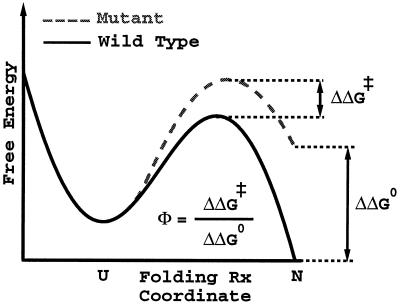
These Φ values should be similar to the measure of
ΔΔG0/ΔΔG‡,
the ratio of the change in the folding activation free energy to the
change in native stability, when the assumption that folding follows a
Kramer's type of equation with a fixed rate prefactor is valid. In the
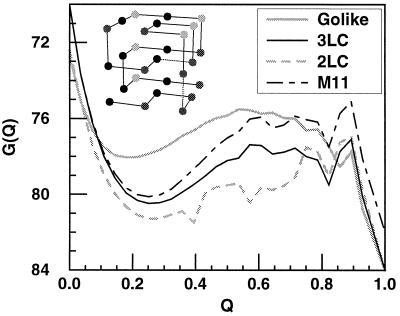
free energy perturbation method, we determine the free energy as a
function of a folding reaction coordinate—in this instance,
Q, the fraction of formed native nonbonded interactions.
The barrier height is defined as the difference in free energy between
the highest free energy point along Q between
5/28 and 23/28 and the free energy of states, with
Q < 16/28. The Φ value is then computed
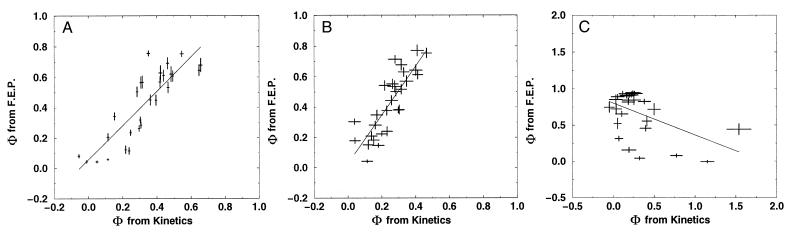
directly from
ΔΔG0/ΔΔG‡
by taking Q < 16/28 as the unfolded
conformations. For both methods, the unfolded state is defined as all
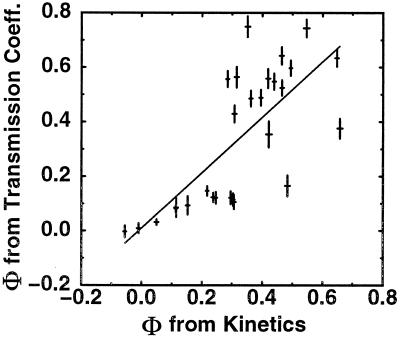
conformations with Q < 16/28. Error bars
show 68% confidence limits calculated from 1,000 bootstrapping
simulations.
−RT
ln(kmut/kwt)/ΔΔG0.
These Φ values should be similar to the measure of
ΔΔG0/ΔΔG‡,
the ratio of the change in the folding activation free energy to the
change in native stability, when the assumption that folding follows a
Kramer's type of equation with a fixed rate prefactor is valid. In the
free energy perturbation method, we determine the free energy as a
function of a folding reaction coordinate—in this instance,
Q, the fraction of formed native nonbonded interactions.
The barrier height is defined as the difference in free energy between
the highest free energy point along Q between
5/28 and 23/28 and the free energy of states, with
Q < 16/28. The Φ value is then computed
directly from
ΔΔG0/ΔΔG‡
by taking Q < 16/28 as the unfolded
conformations. For both methods, the unfolded state is defined as all
conformations with Q < 16/28. Error bars
show 68% confidence limits calculated from 1,000 bootstrapping
simulations.
References
Publication types
MeSH terms
Substances
Grants and funding
LinkOut - more resources
Full Text Sources
