. 2000 Jan 18;97(2):883-8.
doi: 10.1073/pnas.97.2.883.

Kinetics of exocytosis and endocytosis at the cochlear inner hair cell afferent synapse of the mouse

Affiliations

Kinetics of exocytosis and endocytosis at the cochlear inner hair cell afferent synapse of the mouse

T Moser et al. Proc Natl Acad Sci U S A. .

Abstract

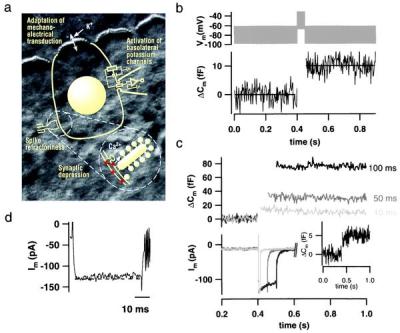
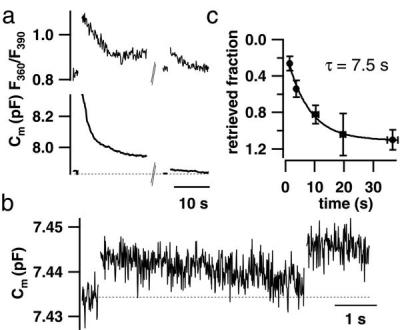
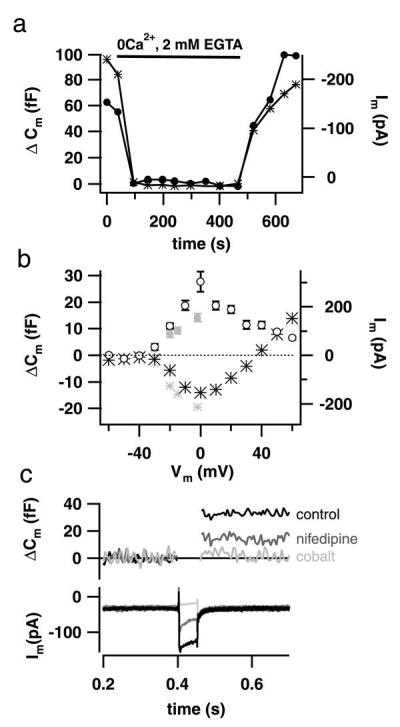
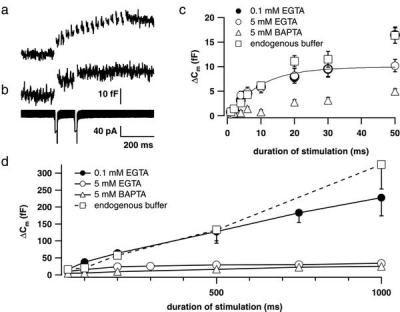
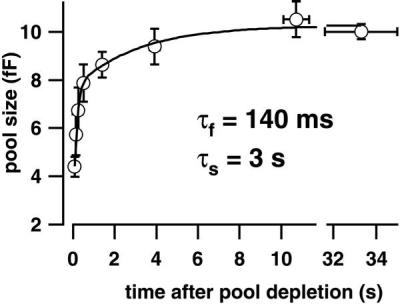
Hearing in mammals relies on the highly synchronous synaptic transfer between cochlear inner hair cells (IHCs) and the auditory nerve. We studied the presynaptic function of single mouse IHCs by monitoring membrane capacitance changes and voltage-gated Ca(2+) currents. Exocytosis initially occurred at a high rate but then slowed down within a few milliseconds, despite nearly constant Ca(2+) influx. We interpret the observed secretory depression as depletion of a readily releasable pool (RRP) of about 280 vesicles. These vesicles are probably docked close to Ca(2+) channels at the ribbon-type active zones of the IHCs. Continued depolarization evoked slower exocytosis occurring at a nearly constant rate for at least 1 s and depending on "long-distance" Ca(2+) signaling. Refilling of the RRP after depletion followed a biphasic time course and was faster than endocytosis. RRP depletion is discussed as a mechanism for fast auditory adaptation.


Figures

Figure 1
Figure 1
Exocytosis recorded by Cm measurements from single IHCs. (a) Simplified representation of an IHC, the measuring configuration, and an afferent IHC synapse (Inset) overlaid onto a Nomarski image of the explanted mouse organ of Corti (stereocilia of the row of IHCs are shown at the top of the image; cell bodies are covered by supporting cells). Previously suggested mechanisms of adaptation are indicated according to their localizations. Synaptic depression could be due to Ca2+ current inactivation, vesicle depletion, or postsynaptic glutamate receptor desensitization. (b) IHCs kept at 35°C in 2 mM [Ca2+]e were stimulated by a 50-ms depolarizing sinusoidal voltage (1 kHz; 40 mV peak to peak added to a dc potential of −50 mV; Upper). Four Cm traces recorded from three cells in the whole-cell configuration (0.1 mM EGTA added to the pipette solution) were averaged and smoothed by box averaging (n = 3; Lower; horizontal lines represent Cm averages before and after stimulation). Cm estimation is not valid during the depolarization because of nonlinear conductance changes. (c) High time resolution plot of ΔCm and membrane currents measured in response to depolarizations (to −15 mV) of different durations in the perforated-patch configuration. ΔCm traces were smoothed by box averaging (n = 3), and current traces were smoothed by binomial smoothing (n = 5). Outward currents were (incompletely) inhibited by intracellular Cs+ and extracellular tetraethylammonium (35 mM). (Inset) Average of four ΔCm traces in response to 4-ms depolarizations (to −15 mV). (d) Representative membrane current response to a 50-ms depolarization to −15 mV in the presence of intracellular (13 mM) and extracellular (35 mM) tetraethylammonium. Very little decline (inactivation) of Ca2+ current was observed under these conditions.
Figure 2
Figure 2
Endocytosis in IHCs. (a) Low time resolution plot of [Ca2+]i (Upper) and Cm (Lower) of a cell. Both Cm and [Ca2+]i increased after a 500-ms pulse, and, 30 s later, smaller responses were elicited by a 50-ms depolarization. After the depolarizations, Cm and [Ca2+]i declined in parallel (whole-cell configuration; 0.1 mM FURA-2 added to the pipette solution). (b) Paired pulses (twice for 15 ms to −15 mV) with variable interval between both stimuli were used to measure the time course of endocytosis in 11 perforated-patch experiments. b shows an example Cm trace with an interval of 5 s (smoothed by box averaging; n = 5). (c) Cm values measured right after the first stimulus and before the second stimulus were used to calculate the endocytosed fraction of the Cm increment elicited by the first depolarization (ΔCm1) at a certain interval. The solid line is an exponential fit to the data.
Figure 3
Figure 3
Cm changes depend strongly on voltage-gated Ca2+ entry. (a) Omission of extracellular Ca2+ (nominally Ca2+-free extracellular solution/2 mM EGTA/3 mM MgCl2) reversibly abolished both voltage-gated Ca2+ entry (asterisks, right axis reversed) and Cm increments (filled circles) stimulated by 100-ms depolarizations to −15 mV. (b) The voltage dependence of ΔCm caused by depolarizations of 200 ms (open circles, two cells) and 25 ms (small filled circles, seven cells) was similar to that of the Ca2+ current (large asterisks, 200 ms; small asterisks, 25 ms). The current–voltage relation is shifted in a positive direction, most likely because of surface charge screening. (c) Nifedipine (3 μM; dark gray) blocked about 50% of both the Ca2+ current (Lower) and the ΔCm (Upper) in this representative example, whereas 5 mM Co2+ (light gray, in the presence of Ca2+) led to full suppression of both Ca2+ current and ΔCm. Cells were depolarized to −15 mV for 50 ms. ΔCm and current traces were smoothed by box averaging (n = 5) and binomial smoothing (n = 5), respectively. All experiments (a–c) were performed in perforated-patch configuration.
Figure 4
Figure 4
Kinetics of exocytosis in IHCs. (a) Recordings (n = 10) of ΔCm responses to trains of 15 depolarizations to −15 mV for 10 ms (20-ms interval) were averaged (scaling as in b). The first depolarization caused the largest response. (b) A paired-pulse paradigm (two 15-ms depolarizations to −15 mV; 100-ms interpulse interval) resulted in a larger first than second ΔCm (Upper). Secretory depression occurred, although Ca2+ currents were nearly identical (Lower). Data represent an average of four responses. (a and b) Experiments were performed in the perforated patch-configuration. (c) ΔCm triggered by depolarizations of different durations to −15 mV plotted against pulse duration up to 50 ms to emphasize the fast secretory component. Experiments were performed in perforated-patch (squares; n = 25) or whole-cell configuration, and then Ca2+ chelators were introduced to the IHC's cytosol as specified. Mixtures of equal amounts of Ca2+-loaded and Ca2+-free chelators were used to avoid possible depriming effects of very low [Ca2+]i levels. Stimulation was started 60 s after establishing the whole-cell configuration. Filled circles, low buffering capacity (0.1 mM Ca2+-free EGTA/0.1 Ca2+-EGTA; n = 33 cells); open circles, high buffering capacity, slower Ca2+-binding (5 mM Ca2+-free EGTA/5 mM Ca2+-EGTA; n = 26 cells); triangles, high buffering capacity, faster Ca2+-binding (5 mM Ca2+-free BAPTA/5 mM Ca2+-BAPTA; n = 16 cells); solid line, exponential fit to the first 50 ms of the “high EGTA” data. (d) Same data set as in c. Slow Cm rise during continued depolarization.
Figure 5
Figure 5
Rapid recovery from RRP depletion. Paired pulses (twice for 15 ms to −15 mV) were used to measure the time course of pool recovery in 11 perforated-patch experiments (see Fig. 2b for an example trace). The second response (ΔCm2), measured at variable times after the first pool-depleting response (ΔCm1), indicated the refilling state of the RRP. The summary plot shows ratios ΔCm2/ΔCm1 multiplied by the steady state ΔCm2 (10.2 fF), which was similar to our RRP size estimate (see Fig. 4C). Solid line, double exponential fit to the data (see Results).

References

    1. Kros C J. In: The Cochlea. Dallos P, Popper A N, Fay R R, editors. New York: Springer; 1996. pp. 318–385.
    1. Kataoka Y, Ohmori H. J Physiol (London) 1994;477:403–414. - PMC - PubMed
    1. Raman I M, Zhang S, Trussell L O. J Neurosci. 1994;14:4998–5010. - PMC - PubMed
    1. Matsubara A, Laake J H, Davanger S, Usami S, Ottersen O P. J Neurosci. 1996;16:4457–4467. - PMC - PubMed
    1. Kiang N Y-S, Watanabe T, Thomas E C, Clark L F. Discharge Pattern of Single Fibers in the Cat's Auditory Nerve. Cambridge, MA: MIT Press; 1965.

Publication types

LinkOut - more resources