. 1999 Nov-Dec;6(6):572-99.
doi: 10.1101/lm.6.6.572.

Dissociation between the effects of damage to perirhinal cortex and area TE

Affiliations

Dissociation between the effects of damage to perirhinal cortex and area TE

E A Buffalo et al. Learn Mem. 1999 Nov-Dec.

Abstract

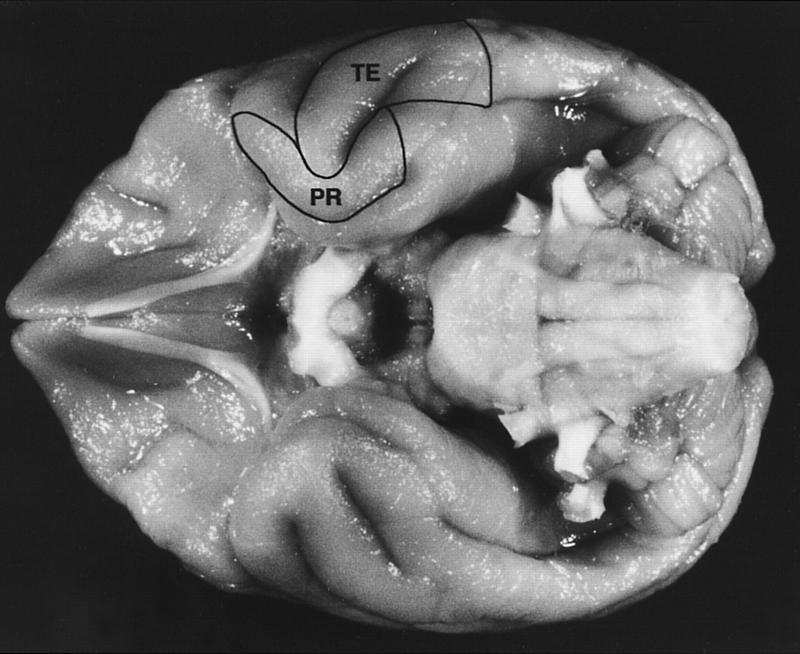
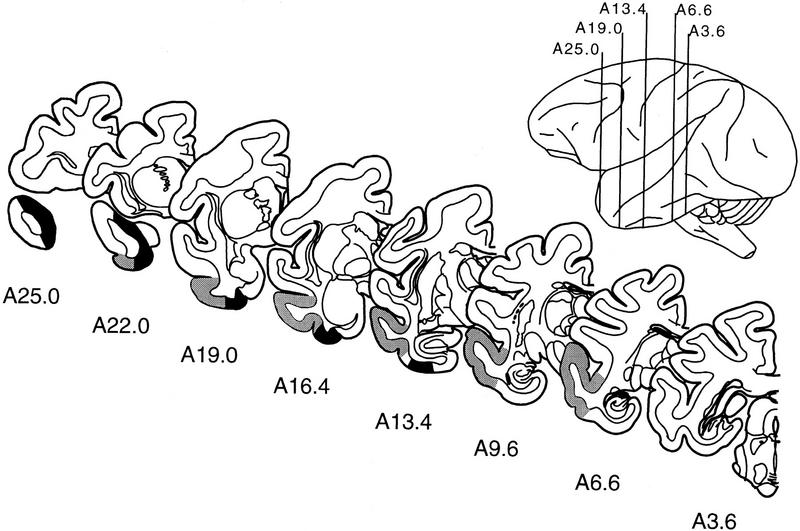
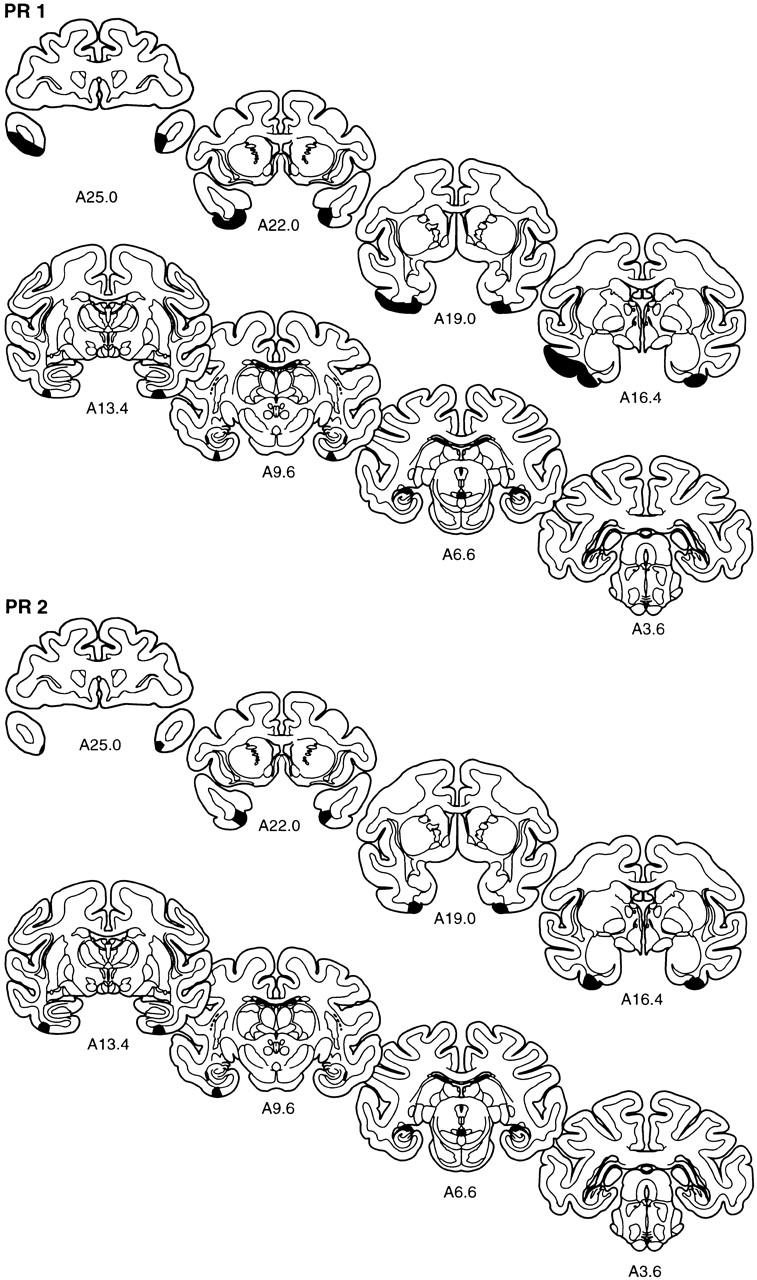
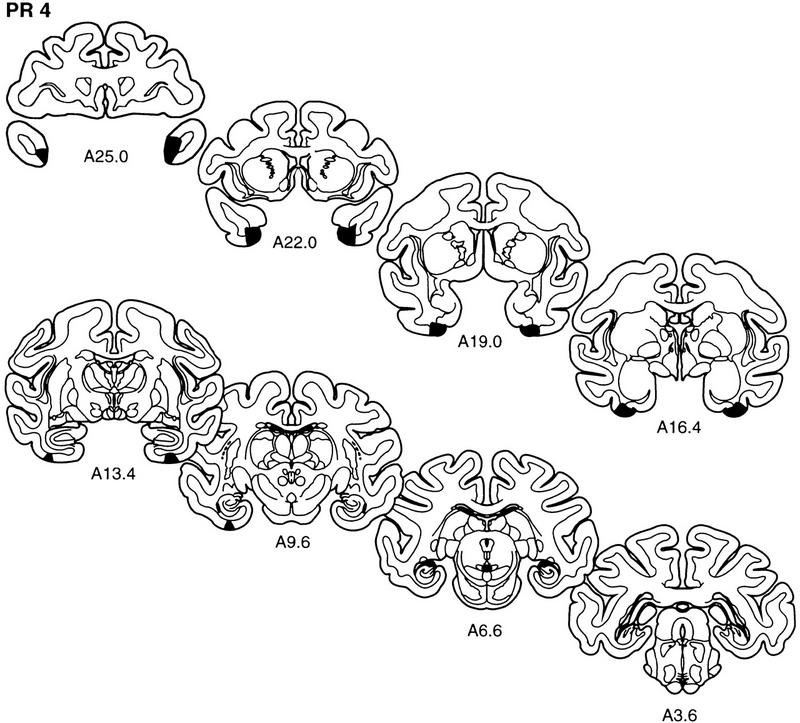
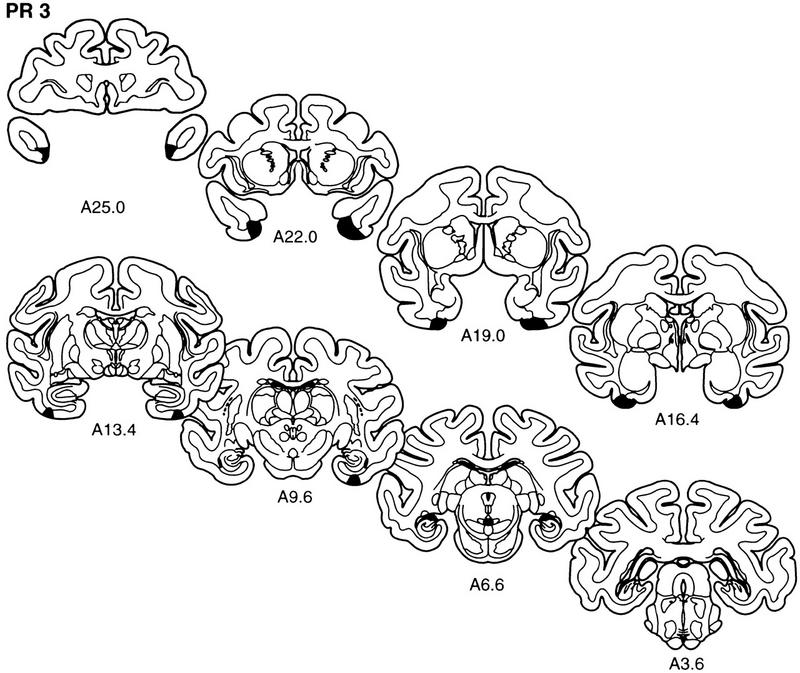
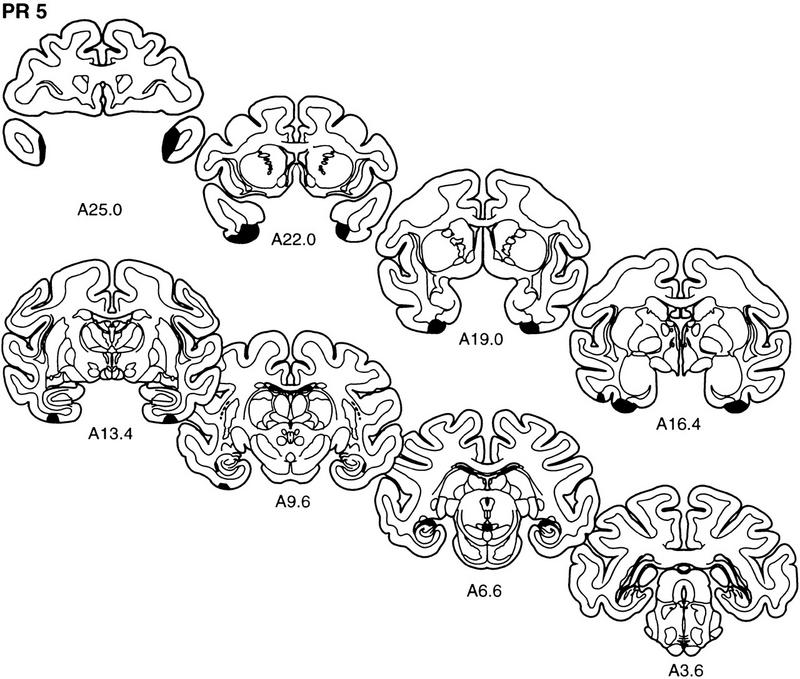
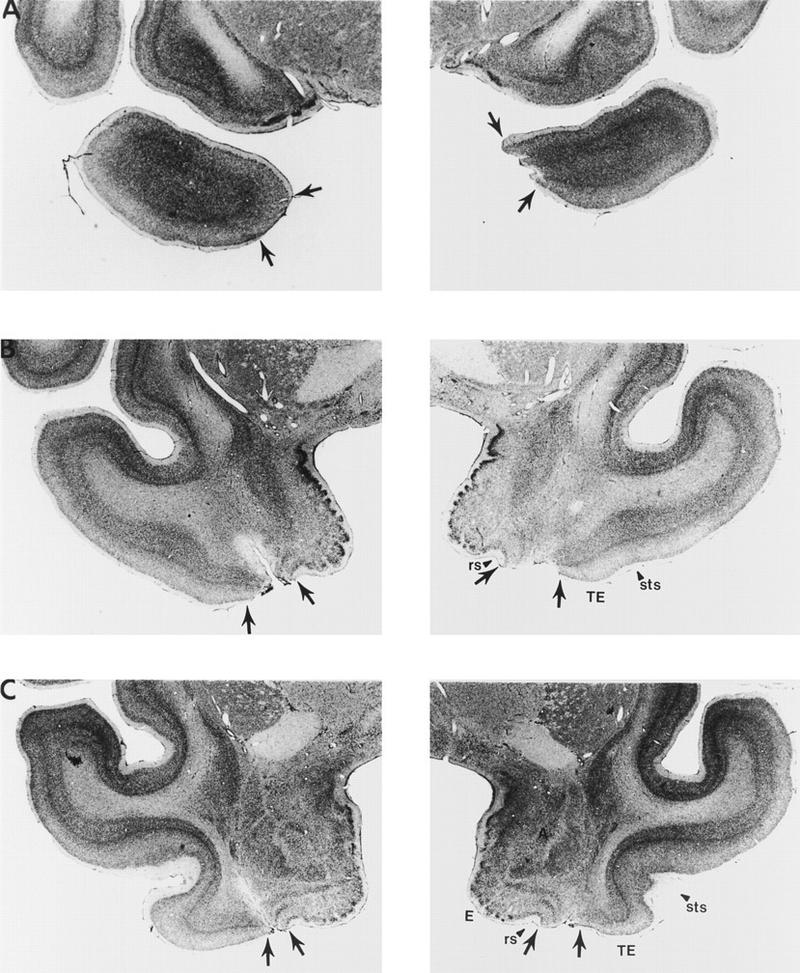
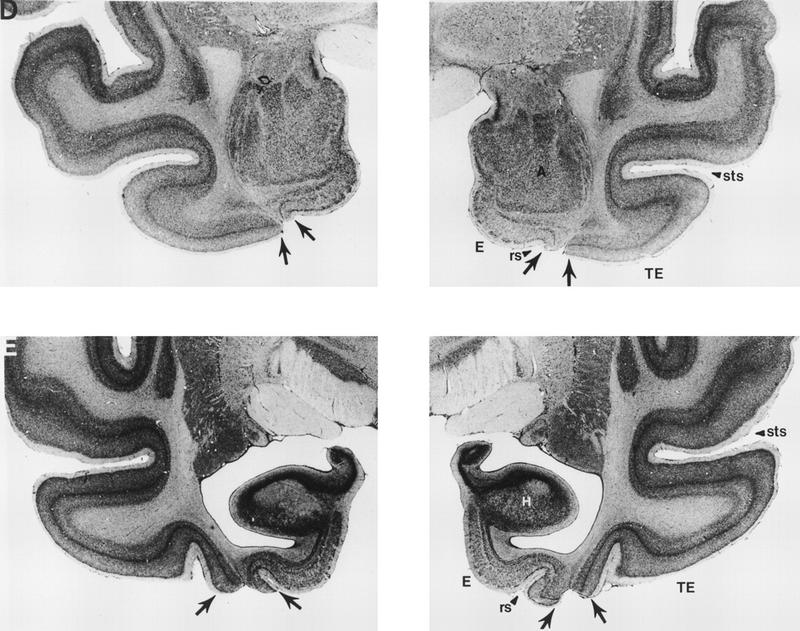
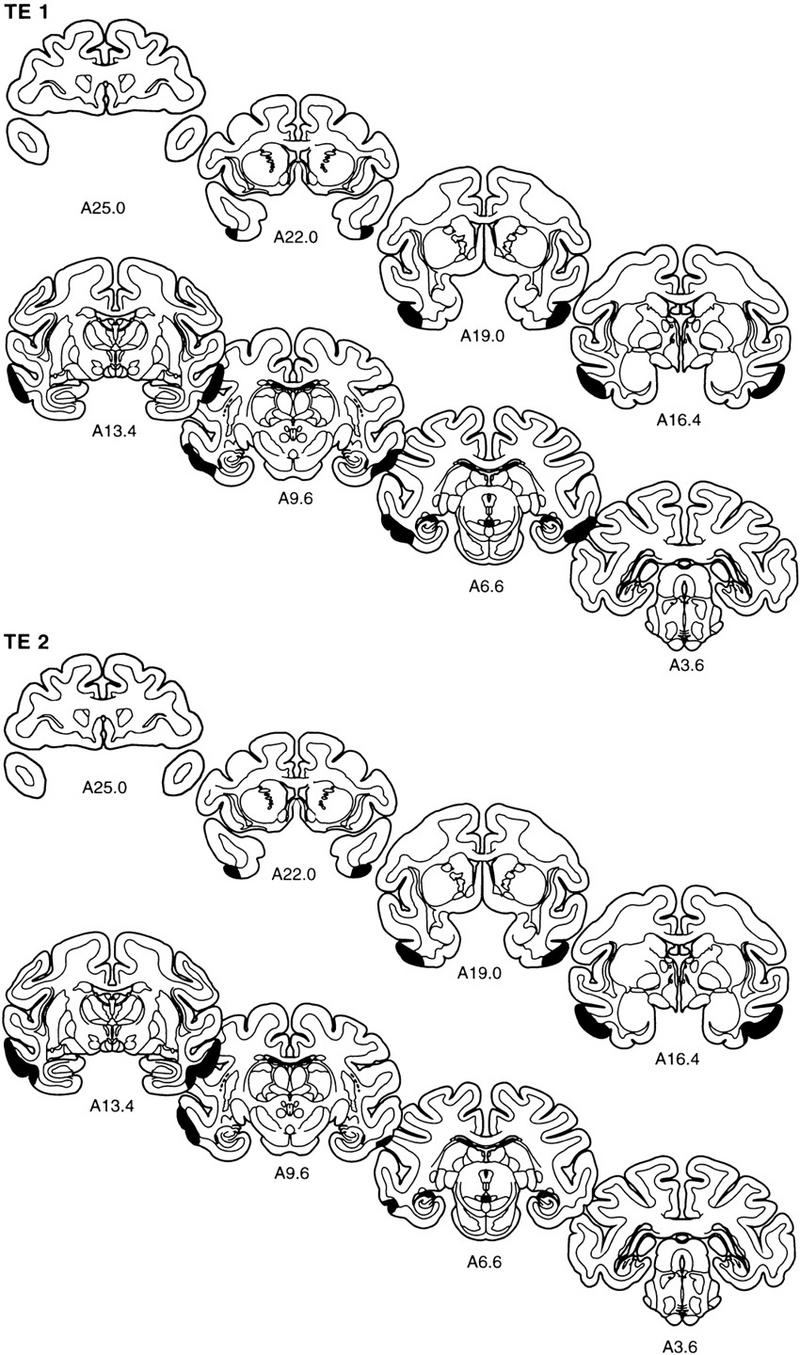
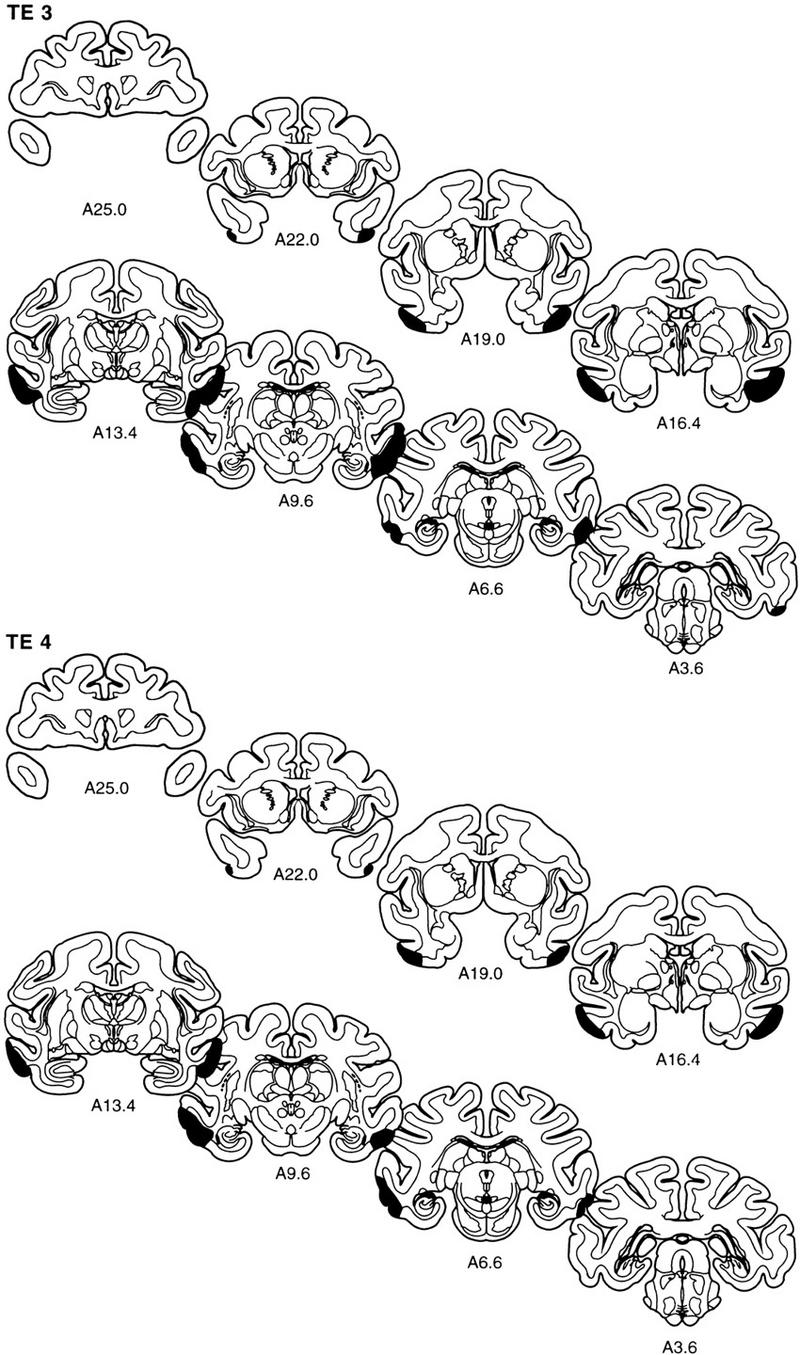
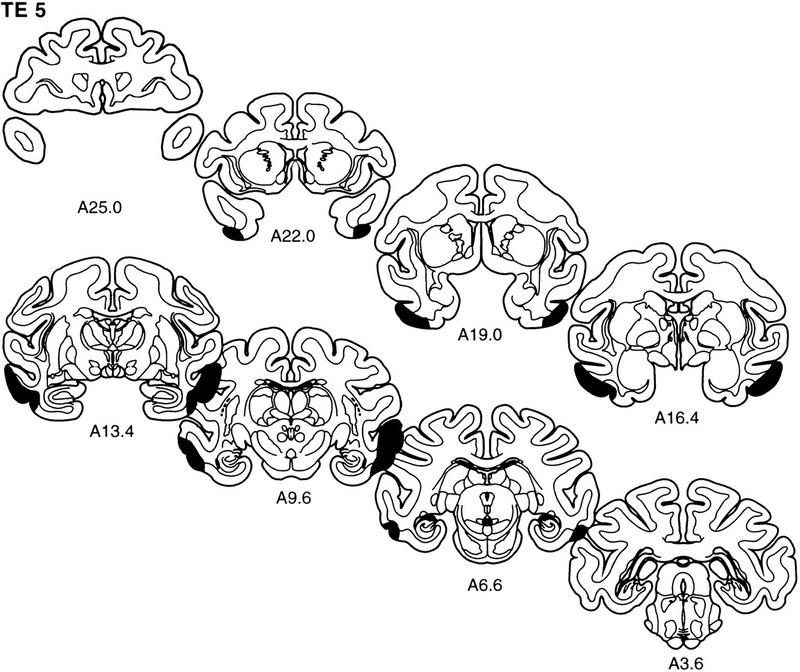
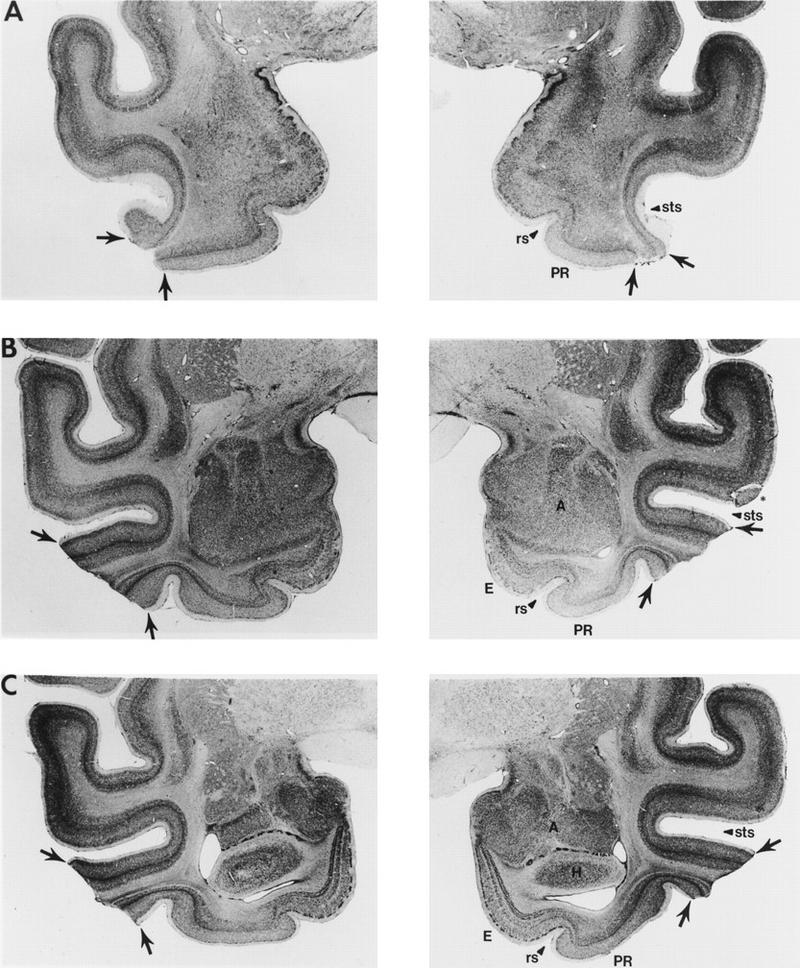
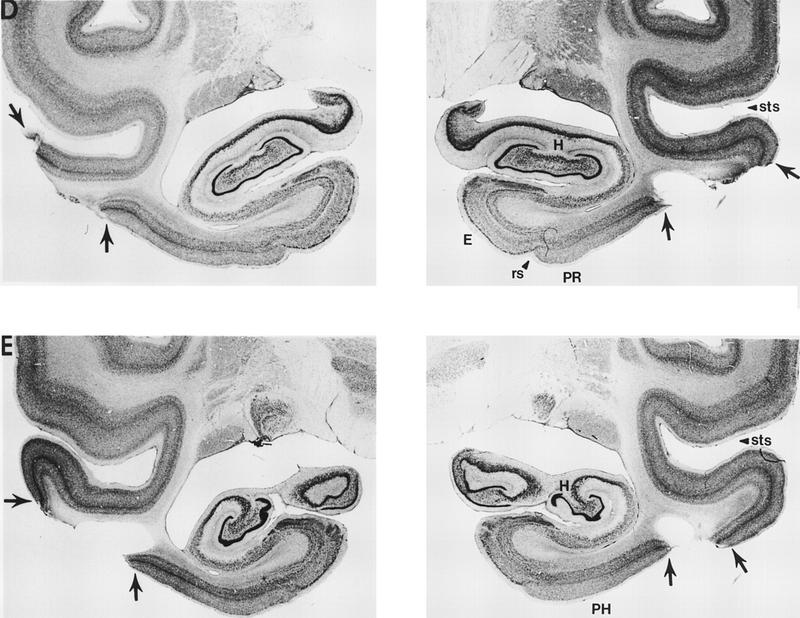
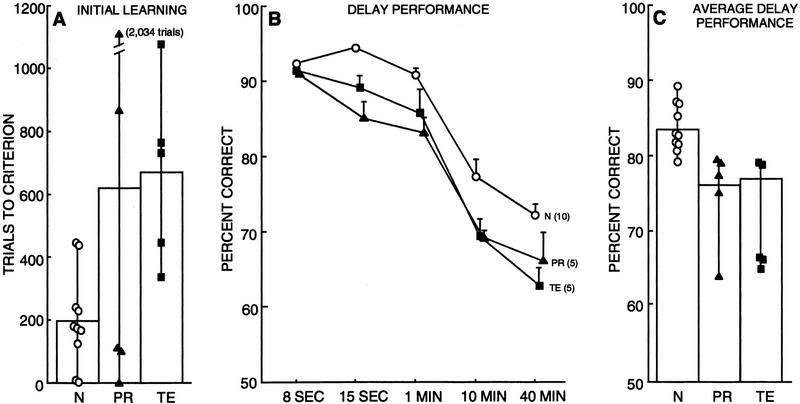
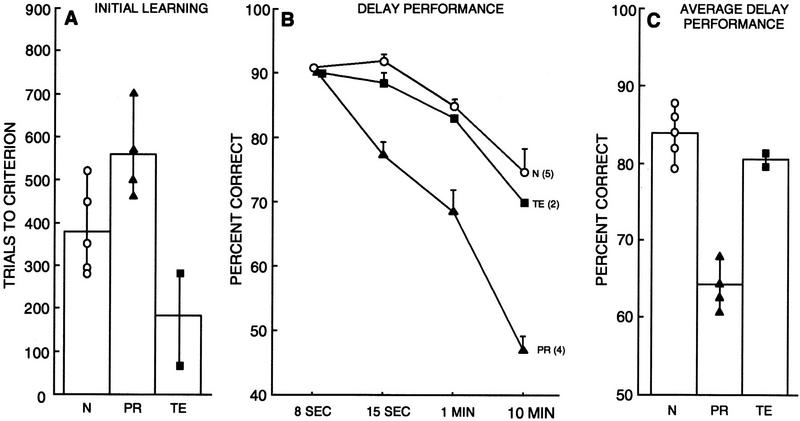
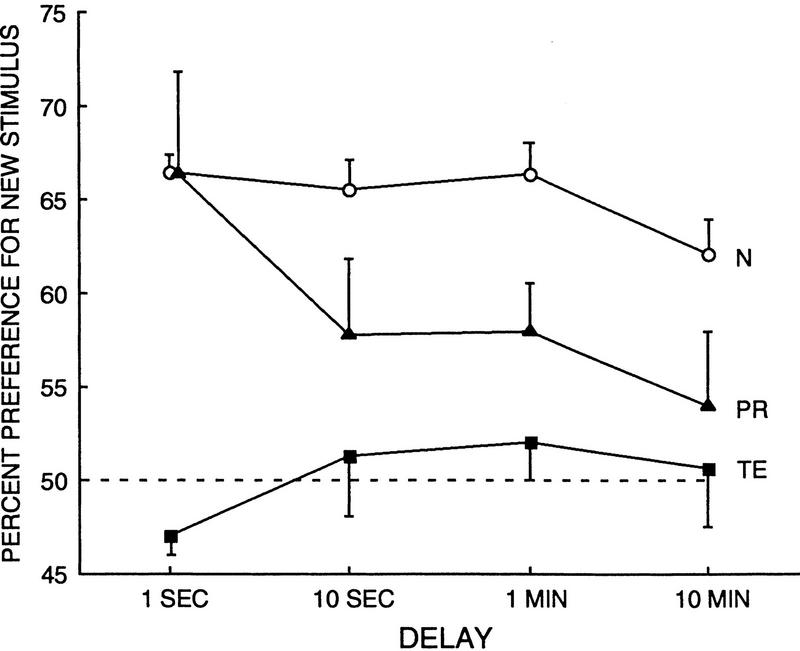
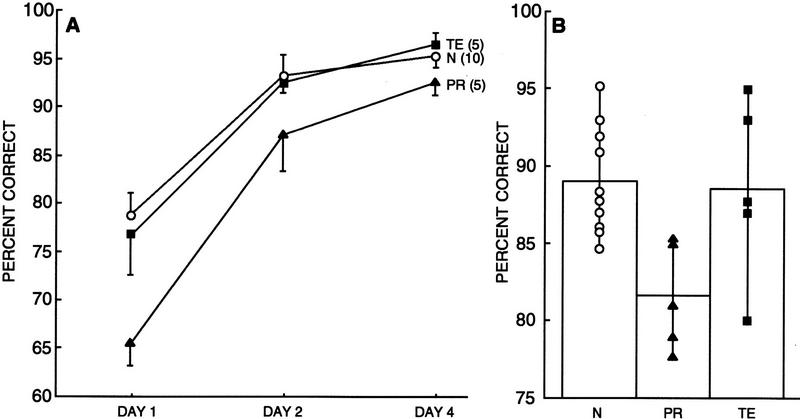
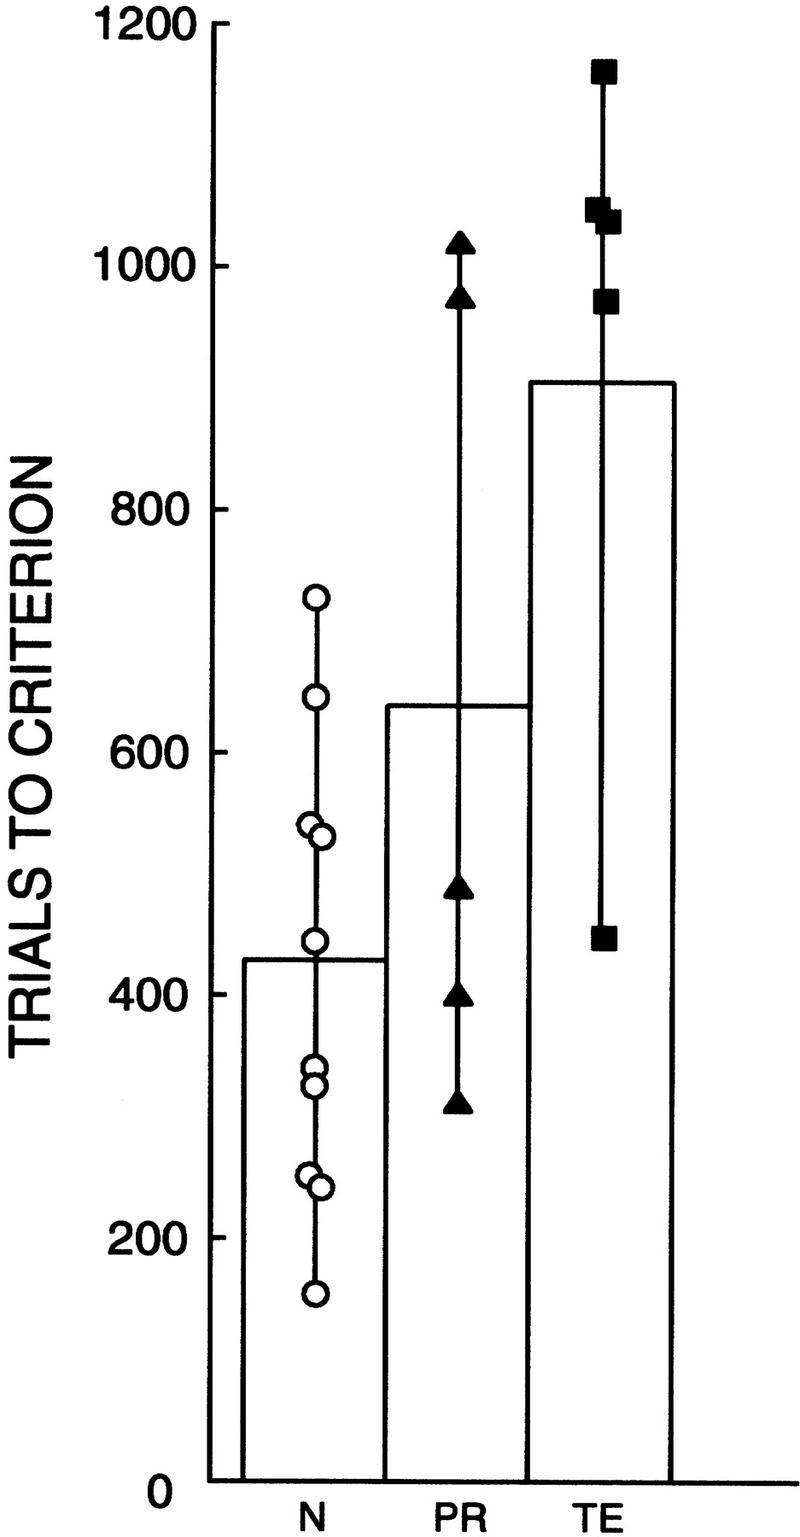
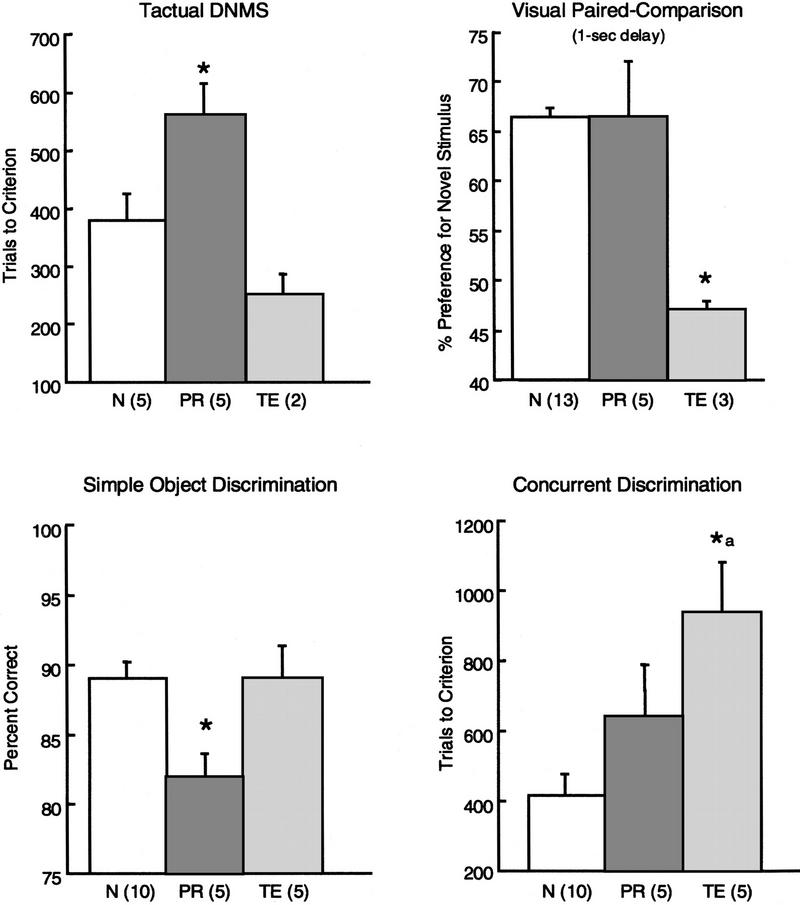
Perirhinal cortex and area TE are immediately adjacent to each other in the temporal lobe and reciprocally interconnected. These areas are thought to lie at the interface between visual perception and visual memory, but it has been unclear what their separate contributions might be. In three experiments, monkeys with bilateral lesions of the perirhinal cortex exhibited a different pattern of impairment than monkeys with bilateral lesions of area TE. In experiment 1, lesions of the perirhinal cortex produced a multimodal deficit in recognition memory (delayed nonmatching to sample), whereas lesions of area TE impaired performance only in the visual modality. In experiment 2, on a test of visual recognition memory (the visual paired comparison task) lesions of the perirhinal cortex impaired performance at long delays but spared performance at a very short delay. In contrast, lesions of area TE impaired performance even at the short delay. In experiment 3, lesions of the perirhinal cortex and lesions of area TE produced an opposite pattern of impairment on two visual discrimination tasks, simple object discrimination learning (impaired only by perirhinal lesions), and concurrent discrimination learning (impaired only by TE lesions). Taken together, the findings suggest that the perirhinal cortex, like other medial temporal lobe structures, is important for the formation of memory, whereas area TE is important for visual perceptual processing.


Figures

Figure 1
Figure 1
The ventral surface of a macaque monkey brain showing the location of the perirhinal cortex (PR) and inferotemporal cortical area TE (TE). The perirhinal cortex forms a band of cortex along the ventromedial surface of the temporal lobe, lateral to the rhinal sulcus. Area TE is located immediately lateral to the perirhinal cortex and consists of a band of cortex lying primarily on the middle temporal gyrus. See Materials and Methods for details concerning the boundaries of the perirhinal cortex and area TE.
Figure 2
Figure 2
Line drawings of representative coronal sections through the temporal lobe of M. fascicularis adapted from the atlas of Szabo and Cowan (1984). The sections are arranged from rostral (A25.0) to caudal (A3.6), and the rostrocaudal position of each section is indicated in the lateral view. The designations A25.0, A22.0, and so on, specify distances anterior (A) to the intra-aural line. The boundaries of the perirhinal cortex are indicated in black, and the boundaries of area TE are indicated in gray.
Figure 3
Figure 3
The extent of the lesions of perirhinal cortex in each of the five monkeys in the PR group (PR 1–PR 5) is plotted on representative coronal sections redrawn from the atlas of Szabo and Cowan (1984). In each case, the area of the lesion is indicated in black. The rostrocaudal level is indicated below each section (see Figs. 1 and 2 for borders of the perirhinal cortex).
Figure 3
Figure 3
The extent of the lesions of perirhinal cortex in each of the five monkeys in the PR group (PR 1–PR 5) is plotted on representative coronal sections redrawn from the atlas of Szabo and Cowan (1984). In each case, the area of the lesion is indicated in black. The rostrocaudal level is indicated below each section (see Figs. 1 and 2 for borders of the perirhinal cortex).
Figure 4
Figure 4
Photomicrographs of representative sections through the left and right temporal lobes of monkey PR 2, whose lesion most closely approximated the intended lesion (see Fig. 2). The sections are arranged from rostral (A) to caudal (E), and the lesion is indicated by arrows at each level. (rs) Rhinal sulcus; (sts) superior temporal sulcus; (TE) area TE; (A) amygdala; (E) entorhinal cortex; (H) hippocampus.
Figure 4
Figure 4
Photomicrographs of representative sections through the left and right temporal lobes of monkey PR 2, whose lesion most closely approximated the intended lesion (see Fig. 2). The sections are arranged from rostral (A) to caudal (E), and the lesion is indicated by arrows at each level. (rs) Rhinal sulcus; (sts) superior temporal sulcus; (TE) area TE; (A) amygdala; (E) entorhinal cortex; (H) hippocampus.
Figure 5
Figure 5
The extent of the lesions of area TE in each of the five monkeys in the TE group (TE 1–TE 5) is plotted on representative coronal sections redrawn from the atlas of Szabo and Cowan (1984). In each case, the area of the lesion is indicated in black. The rostrocaudal level is indicated below each section (see Figs. 1 and 2 for borders of area TE).
Figure 5
Figure 5
The extent of the lesions of area TE in each of the five monkeys in the TE group (TE 1–TE 5) is plotted on representative coronal sections redrawn from the atlas of Szabo and Cowan (1984). In each case, the area of the lesion is indicated in black. The rostrocaudal level is indicated below each section (see Figs. 1 and 2 for borders of area TE).
Figure 6
Figure 6
Photomicrographs of representative sections through the left and right temporal lobes of monkey TE 4, whose lesion most closely approximated the intended lesion (see Fig. 2). The sections are arranged from rostral (A) to caudal (E), and the lesion is indicated by arrows at each level. The asterisk (*) indicates a processing artifact. (rs) Rhinal sulcus; (sts) superior temporal sulcus; (PR) perirhinal cortex; (E) entorhinal cortex; (A) amygdala; (H) hippocampal region; (PH) parahippocampal cortex.
Figure 6
Figure 6
Photomicrographs of representative sections through the left and right temporal lobes of monkey TE 4, whose lesion most closely approximated the intended lesion (see Fig. 2). The sections are arranged from rostral (A) to caudal (E), and the lesion is indicated by arrows at each level. The asterisk (*) indicates a processing artifact. (rs) Rhinal sulcus; (sts) superior temporal sulcus; (PR) perirhinal cortex; (E) entorhinal cortex; (A) amygdala; (H) hippocampal region; (PH) parahippocampal cortex.
Figure 7
Figure 7
Performance on the V-DNMS task by normal monkeys (N = 10), monkeys with lesions of the perirhinal cortex (PR = 5), and monkeys with lesions of area TE (TE = 5). (A) Performance on initial learning on the first administration of the V-DNMS task with an 8-sec delay. Symbols show trials to criterion for individual monkeys. (B) Performance across delays on the two administrations of the V-DNMS task, averaged together for each monkey. Bars represent s.e.m.. (C) Performance across all delays (15 sec, 1 min, 10 min, and 40 min averaged together) on the two administrations of the V-DNMS task. Symbols show the performance of individual monkeys. See Table 1 for individual scores of all monkeys.
Figure 8
Figure 8
Performance on the T-DNMS task by normal monkeys (N = 5), monkeys with lesions of the perirhinal cortex (PR = 4), and monkeys with lesions of area TE (TE = 2). (A) Performance on initial learning of the T-DNMS with an 8-sec delay. Symbols show trials to criterion for individual monkeys. (B) Performance across delays on the T-DNMS task. Bars represent s.e.m. (C) Performance across all delays (15 sec, 1 min, and 10 min averaged together) on the T-DNMS task. Symbols show the performance of individual monkeys. See Table 1 for individual scores of all monkeys.
Figure 9
Figure 9
Performance on the VPC task by normal monkeys (N = 13), monkeys with lesions of the perirhinal cortex (PR = 5), and monkeys with lesions of area TE (TE = 3). Bars represent s.e.m. Broken line represents chance performance.
Figure 10
Figure 10
(A) Average daily performance on four simple object discrimination tasks by normal monkeys (N = 10), monkeys with lesions of the perirhinal cortex (PR = 5), and monkeys with lesions of area TE (TE = 5). Bars represent the s.e.m. (B) Performance of the same monkeys averaged across all 3 days of testing. Symbols show the performance of individual monkeys (see also Table 1).
Figure 11
Figure 11
Performance on the concurrent discrimination learning task by normal monkeys (N = 10), monkeys with lesions of the perirhinal cortex (PR = 5), and monkeys with lesions of area TE (TE = 5). Symbols show trials to criterion for individual monkeys.
Figure 12
Figure 12
(A) Performance on the T-DNMS task (trials to criterion), the VPC task (1-sec delay), the simple object discrimination task (mean of 3 test days), and the concurrent discrimination learning task (trials to criterion) by monkeys with lesions of the perirhinal cortex (PR), monkeys with lesions of area TE (TE), and normal monkeys (N). Asterisks (*) denote a significant difference between the PR and TE groups and impaired performance relative to normal monkeys (P < 0.05). (a) A marginally significant difference between the PR and TE groups; P = 0.08. The numbers in parentheses indicate the number of monkeys in each group. Bars represent the s.e.m.

References

    1. Bachevalier J, Brickson M, Hagger C. Limbic-dependent recognition memory in monkeys develops early in infancy. NeuroReport. 1993;4:77–80. - PubMed
    1. Baxter MG, Hadfield WS, Murray EA. Rhinal cortex lesions produce mild deficits in visual discrimination learning for auditory secondary reinforcer in rhesus monkeys. Behav Neurosci. 1999;113:243–252. - PubMed
    1. Brodmann K. Vergleichende Lokalisationslehre der Grosshirnrinde in ihren Prinzipien dargestellt auf Grund des zellenbaues. Leipzig, Germany: Barth; 1909.
    1. Buckley MJ, Gaffan D. Impairment of visual object-discrimination learning after perirhinal cortex ablation. Behav Neurosci. 1997;111:467–475. - PubMed
    1. ————— Learning and transfer of object-reward associations and the role of the perirhinal cortex. Behav Neurosci. 1998a;112:15–23. - PubMed

Publication types

LinkOut - more resources