. 2000 Feb;74(4):1973-84.
doi: 10.1128/jvi.74.4.1973-1984.2000.

Disruption of the murine gammaherpesvirus 68 M1 open reading frame leads to enhanced reactivation from latency

Affiliations

Disruption of the murine gammaherpesvirus 68 M1 open reading frame leads to enhanced reactivation from latency

E T Clambey et al. J Virol. 2000 Feb.

Abstract

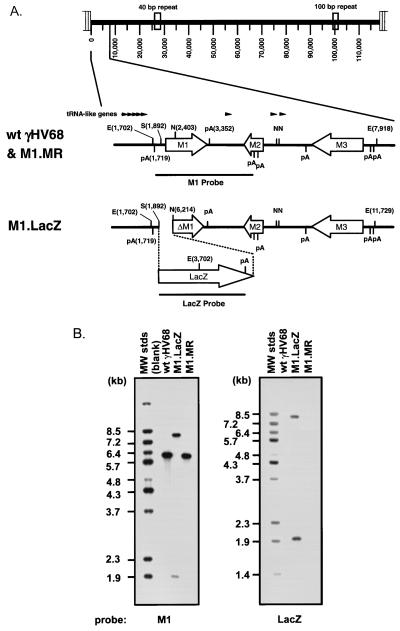
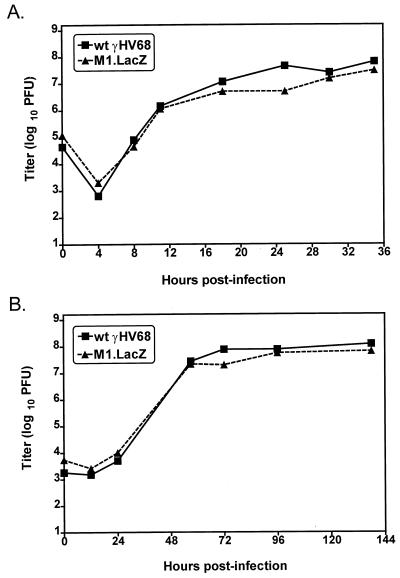
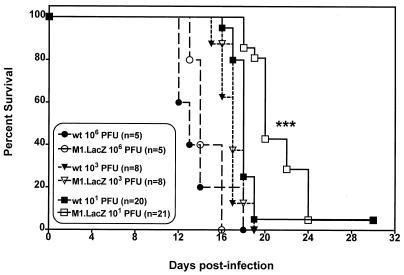
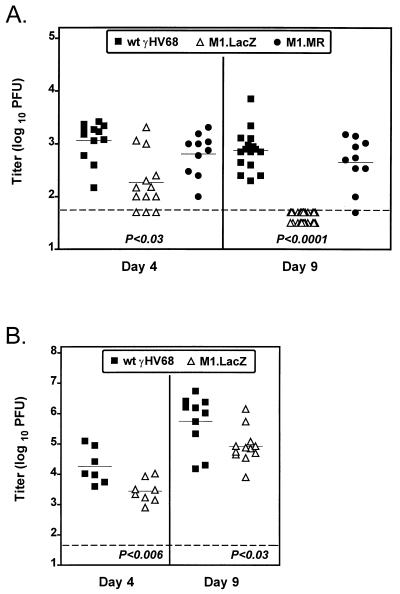
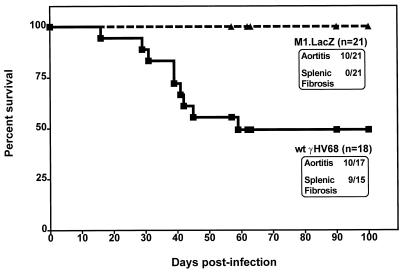
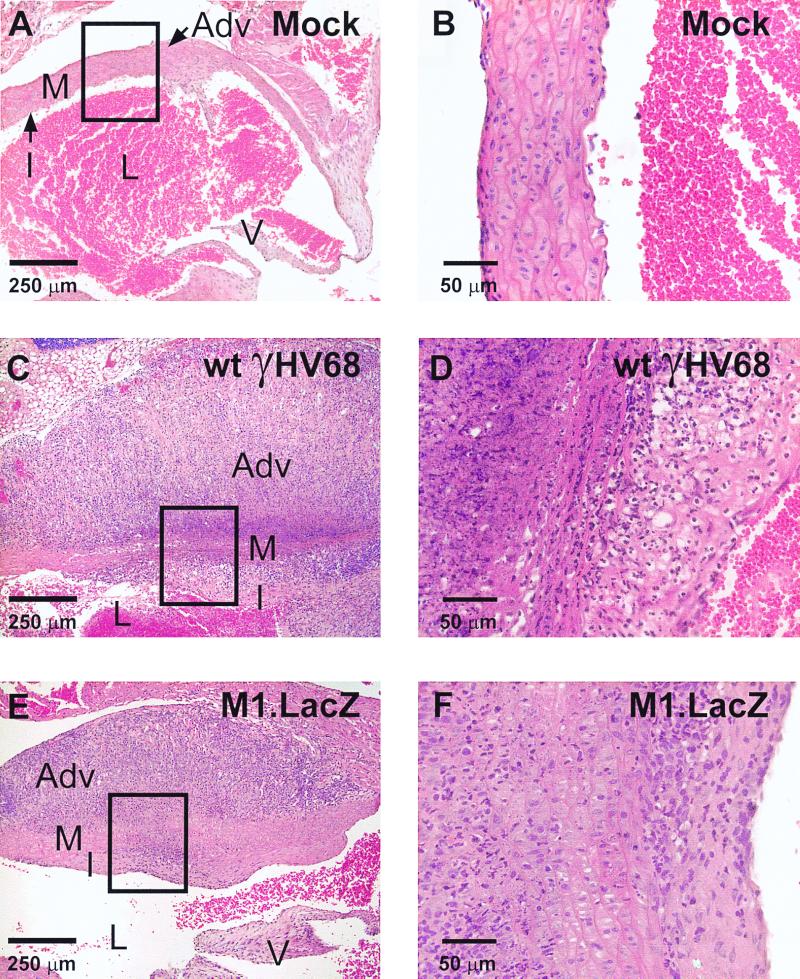
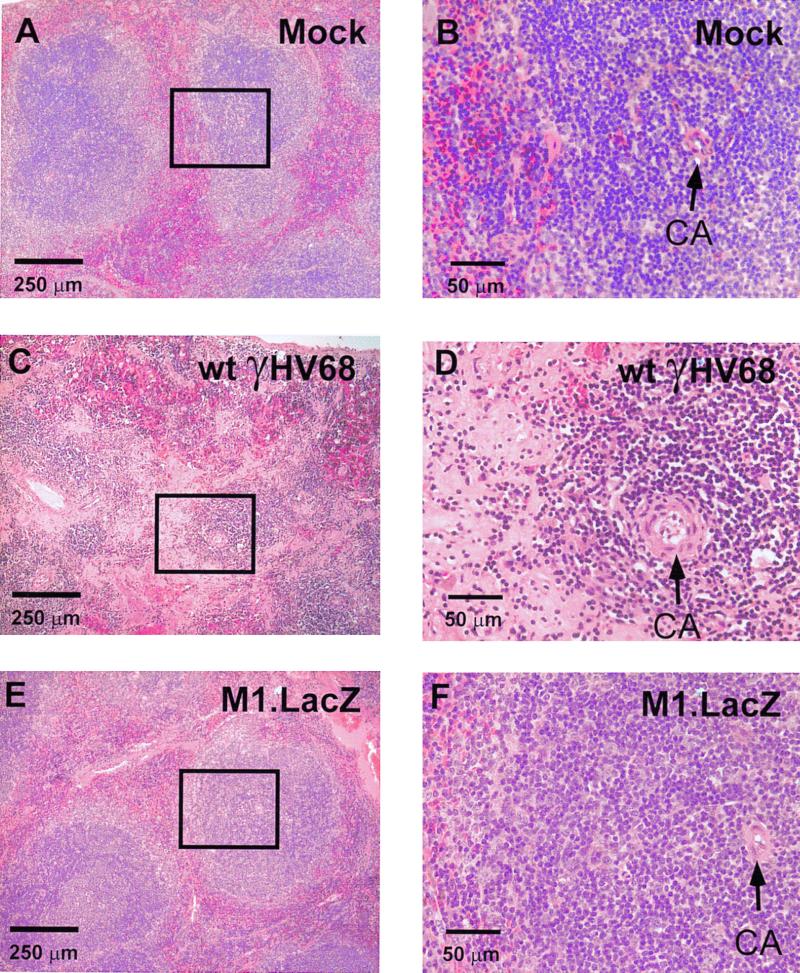
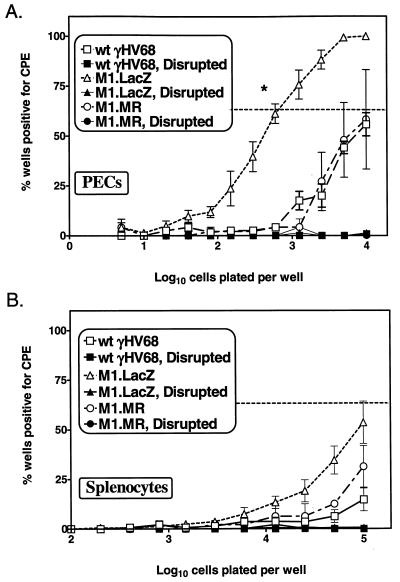
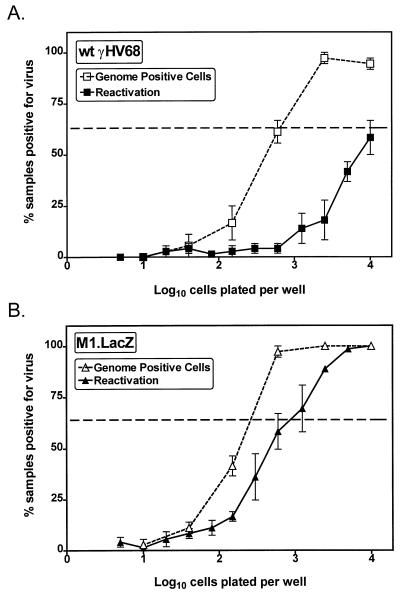
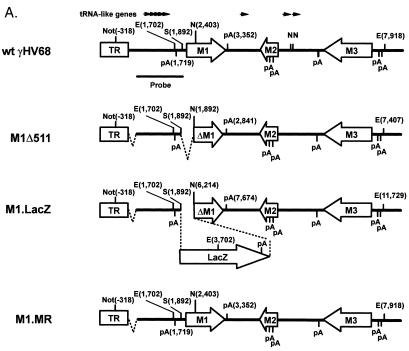
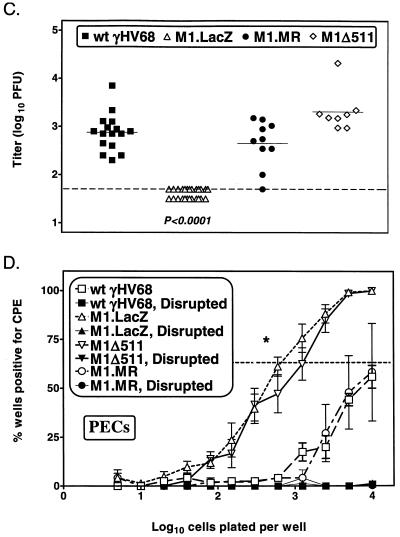
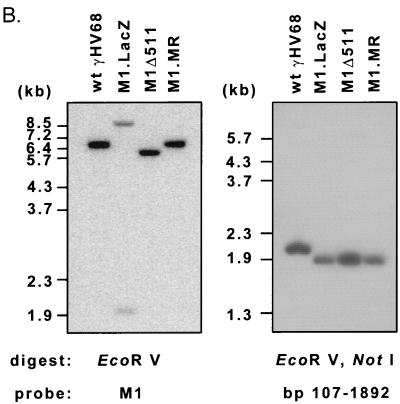
Murine gammaherpesvirus 68 (gammaHV68, or MHV-68) is a genetically tractable, small animal model for the analysis of gammaherpesvirus pathogenesis. The gammaHV68 genome is colinear with the genomes of other sequence gammaherpesviruses, containing large blocks of conserved genes interspersed by a number of putative genes without clear homologs in the other gammaherpesviruses. One of these putative unique genes, the M1 open reading frame (ORF), exhibits sequence homology to a poxvirus serine protease inhibitor, SPI-1, as well as to another gammaHV68 gene, M3, which we have recently shown encodes an abundantly secreted chemokine binding protein. To assess the contribution of the M1 ORF to gammaHV68 pathogenesis, we have generated a recombinant gammaHV68 in which the M1 ORF has been disrupted through targeted insertion of a lacZ expression cassette (M1.LacZ). Although M1.LacZ replicated normally in tissue culture, it exhibited decreased splenic titers at days 4 and 9 postinfection in both immunocompetent and immunodeficient mice. Despite decreased levels of acute virus replication, M1.LacZ established a latent infection comparable to wild-type (wt) gammaHV68, but exhibited an approximately fivefold increase in efficiency of reactivation from latency. M1.LacZ also caused severe vasculitis of the great elastic arteries in gamma interferon receptor (IFN-gammaR)-deficient mice with a frequency comparable to wt gammaHV68, but did not cause the mortality or splenic pathology observed with wt gammaHV68 infection of IFN-gammaR-deficient mice. Restoration of M1 ORF sequences into M1.LacZ (M1 marker rescue, or M1.MR) demonstrated that M1.LacZ phenotypic alterations in growth in vivo and latency were not due to the presence of additional mutations located elsewhere in the M1. LacZ genome. Generation of a second M1 mutant virus containing a deletion at the 5' end of the M1 ORF (M1Delta511), but lacking the LacZ expression cassette, revealed the same latency phenotype observed with the M1.LacZ mutant. However, M1Delta511 was not attenuated for acute virus replication in the spleen. We conclude that (i) the induction of arteritis in gammaHV68-infected IFN-gammaR-deficient mice can occur in the absence of splenic pathology and mortality, (ii) replication during acute infection is not the primary determinant for the establishment of latent infection, and (iii) the M1 ORF, or a closely linked gene, encodes a gene product that functions to suppress virus reactivation.


Figures

FIG. 1
FIG. 1
Construction and verification of the M1.LacZ virus. (A) Genomic structure of wt γHV68, M1.LacZ, and M1.MR in the region containing the M1 ORF. In M1.LacZ, the M1 ORF was disrupted through targeted excision of bp 1892 to 2403 of the viral genome by using the restriction enzymes StuI (S) and NgoMI (N). Putative polyadenylation signals are denoted as pA, with poly(A) signals on the top strand indicated by a bar above the horizontal line and poly(A) signals on the bottom strand indicated by a bar below the horizontal line. Genome coordinates of the ORFs in wt γHV68 are as follows: M1, bp 2023 to 3282; M2, bp 4031 to 4627; and M3, bp 6060 to 7277. All genome coordinates are based on the γHV68 WUMS sequence (35). Note that the base pair coordinates for M1.LacZ are calculated based on the inserted mutation. (B) Southern blot analysis of wild-type γHV68, M1.LacZ, and M1.MR viral genomes. Viral DNA was purified from virus stocks and subsequently digested with EcoRV (E), electrophoresed, blotted, and hybridized with either a probe spanning the M1 ORF and flanking sequence (bp 1702 to 4308) or a probe containing the LacZ expression cassette (see panel A for the locations of the probes). 32P-labeled molecular weight standards (MW stds) (Lambda DNA-BstEII digest; New England Biolabs) were included on each Southern blot; the fragment sizes are indicated to the left of each blot.
FIG. 2
FIG. 2
M1.LacZ replicates comparably to wt γHV68 in vitro. NIH 3T12 monolayers were infected with either 5 (A) or 0.05 (B) PFU per cell, and samples were harvested at the times indicated. Samples were freeze-thawed four times and subsequently quantitated by plaque assay on NIH 3T12 monolayers. Data are representative of two (A) or three (B) independent experiments. Data are shown as log10 titer. The sensitivity of this plaque assay is 50 PFU, or 1.7 in log10.
FIG. 3
FIG. 3
M1.LacZ kills C.B-17 SCID mice with kinetics similar to those of wt γHV68. C.B-17 SCID mice were infected by i.p. injection with 106, 103, or 101 PFU. Data were compiled from one (106 PFU), two (103 PFU), or four (101 PFU) independent experiments, with the total number of mice analyzed indicated in parentheses. ∗∗∗, survival (at 101 PFU) of M1.LacZ-infected mice significantly different from that of wt γHV68-infected mice (P < 0.0005).
FIG. 4
FIG. 4
M1.LacZ-infected mice have decreased acute viral titers in the spleen compared to wt γHV68-infected mice. C57BL/6 (A) or B6.Rag1-deficient (B) mice were infected with 106 PFU of wt γHV68, M1.LacZ, or M1.MR by i.p. injection. Spleens were harvested at either day 4 or day 9 postinfection. Data for C57BL/6 mice were compiled from two (M1.MR at days 4 and 9), three (wt γHV68, M1.LacZ at day 4), four (wt γHV68 at day 9), or five (M1.LacZ at day 9) independent experiments with a total of 8 to 20 mice per time point. Data for B6.Rag1-deficient mice represent two (day 4) or three (day 9) independent experiments, with 7 to 12 mice total per time point. Each point represents the viral splenic titer of an individual mouse, with the horizontal solid line indicating the mean titer for each group. The horizontal dashed line indicates the level of detection for this assay (50 PFU, or 1.7 in log10). M1.LacZ values which significantly differ from those of the wt γHV68 and M1.MR (A) and values which significantly differ from those of wt γHV68 (B) are indicated below each set of data.
FIG. 5
FIG. 5
M1.LacZ induces aortitis, but fails to induce either mortality or splenic fibrosis or atrophy in IFN-γR-deficient mice. IFN-γR-deficient mice were infected with 5 × 10⁶ PFU of either wt γHV68 or M1.LacZ, and animals were monitored for the course of infection. During the course of infection, mortality was recorded. Total cumulative pathology is indicated for each group. Animals were sacrificed between days 57 and 100 postinfection, at which time, organs were harvested. Heart and lung sections were analyzed for the presence of aortitis, and spleens were examined for splenic fibrosis or atrophy (assessed independently by three investigators). Data were compiled from five independent experiments, with the total number of mice analyzed indicated. Survival was significantly different between wt γHV68- and M1.LacZ-infected IFN-γR-deficient mice (P < 0.0003), as was the penetrance of splenic fibrosis or atrophy (P < 0.0001). For the wt γHV68-infected group, one mouse was disposed of prior to autopsy, and two mice did not have a spleen at the time of autopsy.
FIG. 6
FIG. 6
M1.LacZ induces aortitis comparable to that induced by wt γHV68 in IFN-γR-deficient mice. Representative cross-sections of aorta from a mock-infected IFN-γR-deficient mouse (A and B), a wt γHV68-infected IFN-γR-deficient mouse (C and D), and an M1.LacZ-infected IFN-γR-deficient mouse (E and F). The wt γHV68- and M1.LacZ-infected mice were sacrificed at 9 weeks postinfection (days 62 and 63 p.i.). All sections are stained with H&E. L, lumen; I, intima; M, media; Adv, adventitia; V, aortic valve. Boxed regions in panels A, C, and E are approximate fields shown at higher magnification in panels B, D, and F, respectively. Mice were from the experimental groups described in the legend to Fig. 5.
FIG. 7
FIG. 7
M1.LacZ fails to induce splenic fibrosis or atrophy in IFN-γR-deficient mice. Representative histology of spleens from either a mock-infected IFN-γR-deficient mouse (A and B), a wt γHV68-infected IFN-γR-deficient mouse (C and D), and an M1.LacZ-infected IFN-γR-deficient mouse (E and F). All sections were stained with H&E. CA, central arteriole. Boxed regions in panels A, C, and E are approximate fields shown at higher magnification in panels B, D, and F, respectively. The wt γHV68-infected spleen was from a mouse that died at day 29 postinfection. The M1.LacZ-infected spleen was from a mouse that was sacrificed at day 62 postinfection. Mice were from the experimental groups described in the legend to Fig. 5.
FIG. 8
FIG. 8
M1.LacZ establishes a latent infection characterized by an increased frequency of ex vivo reactivation from latency. B6 mice were infected with 106 PFU of wt γHV68, M1.LacZ, or M1.MR and were harvested between days 42 and 50 postinfection. Samples were tested for ex vivo reactivation with PECs (A) and splenocytes (B). For each cell dilution, 24 wells were analyzed per experiment. The horizontal dashed line indicates 63%, which was used to calculate the frequency of reactivation of cells by Poisson distribution. Mechanically disrupted cells were plated in parallel to identify the presence of preformed infectious virus, as described in Materials and Methods. Data represent two (M1.MR), five (wt γHV68), or six (M1.LacZ) independent experiments, with cells pooled from three to five mice per experiment per group. Data are shown as mean percentage of wells positive for CPE ± standard error of the mean. The M1.LacZ frequency of reactivation from PECs was significantly different from that of wt γHV68 (P < 0.0005)- or M1.MR (P < 0.04)-infected mice (asterisk in panel A).
FIG. 9
FIG. 9
M1.LacZ has an increased efficiency of reactivation from latency. Latently-infected PECs were analyzed for the frequency of viral genome by nested PCR in wt γHV68-infected mice (A) or in M1.LacZ-infected mice (B). Twelve PCRs were performed per cell dilution for each experiment, with the inclusion of PCR specificity controls as discussed in Materials and Methods. The reactivation data shown are from three independent experiments presented in Fig. 8. The horizontal dashed line indicates 63%, which was used to calculate the frequency of genome-positive cells and cells reactivating virus by Poisson distribution. The data represent three independent experiments with cells pooled from three to five mice per group. Data are shown as mean percentage of wells positive for viral genome or CPE ± standard error of the mean. M1.LacZ latently infected PECs had a statistically significant increase in the frequency of reactivation (P < 0.0005) and viral-genome-positive cells (P < 0.03) compared with wt γHV68 latently-infected PECs.
FIG. 10
FIG. 10
Construction and characterization of M1Δ511. (A) Genomic structure of wt γHV68, M1.LacZ, M1Δ511, and M1.MR in the region containing the M1 ORF. In both M1.LacZ and M1Δ511, the M1 ORF was disrupted through targeted excision of bp 1892 to 2403 of the viral genome by using the restriction enzymes StuI (S) and NgoMI (N). TR indicates terminal repeat sequence, with Not indicating a NotI restriction site. In M1.LacZ, M1Δ511, and M1.MR, there was an ∼100-bp deletion which removed the first 100 bp of γHV68 unique sequence, denoted by a dashed line. Further annotations are the same as those described for Fig. 1A. (B) Southern blot analysis of wt γHV68, M1.LacZ, M1Δ511, and M1.MR viral genomes following either an EcoRV or a NotI-EcoRV restriction enzyme digest followed by the indicated probe (M1 probe [Fig. 1A] or probe specific for bp 107 to 1892 of γHV68]), with molecular size markers indicated to the left. A longer exposure of the NotI-EcoRV Southern blot revealed hybridization with the higher-molecular-weight restriction fragments predicted for each virus (data not shown). (C) Day 9 splenic viral titer of C57BL/6 mice infected with M1Δ511 compared with wt γHV68, M1.LacZ, and M1.MR (106 PFU by i.p. injection). The data include two experiments which contained wt γHV68, M1.LacZ, and M1Δ511 with seven or eight mice total per group, with additional data included from Fig. 4A. M1.LacZ titers significantly differed from wt γHV68, M1Δ511, and M1.MR titers, as indicated. (D) Ex vivo reactivation frequency of PECs from C57BL/6 mice infected with M1Δ511 (106 PFU by i.p. injection) harvested between days 44 and 50 postinfection. The data include three experiments which contained wt γHV68, M1.LacZ, and M1Δ511 with cells pooled from three to five mice per group per experiment, with additional data included from Fig. 8A.
FIG. 10
FIG. 10
Construction and characterization of M1Δ511. (A) Genomic structure of wt γHV68, M1.LacZ, M1Δ511, and M1.MR in the region containing the M1 ORF. In both M1.LacZ and M1Δ511, the M1 ORF was disrupted through targeted excision of bp 1892 to 2403 of the viral genome by using the restriction enzymes StuI (S) and NgoMI (N). TR indicates terminal repeat sequence, with Not indicating a NotI restriction site. In M1.LacZ, M1Δ511, and M1.MR, there was an ∼100-bp deletion which removed the first 100 bp of γHV68 unique sequence, denoted by a dashed line. Further annotations are the same as those described for Fig. 1A. (B) Southern blot analysis of wt γHV68, M1.LacZ, M1Δ511, and M1.MR viral genomes following either an EcoRV or a NotI-EcoRV restriction enzyme digest followed by the indicated probe (M1 probe [Fig. 1A] or probe specific for bp 107 to 1892 of γHV68]), with molecular size markers indicated to the left. A longer exposure of the NotI-EcoRV Southern blot revealed hybridization with the higher-molecular-weight restriction fragments predicted for each virus (data not shown). (C) Day 9 splenic viral titer of C57BL/6 mice infected with M1Δ511 compared with wt γHV68, M1.LacZ, and M1.MR (106 PFU by i.p. injection). The data include two experiments which contained wt γHV68, M1.LacZ, and M1Δ511 with seven or eight mice total per group, with additional data included from Fig. 4A. M1.LacZ titers significantly differed from wt γHV68, M1Δ511, and M1.MR titers, as indicated. (D) Ex vivo reactivation frequency of PECs from C57BL/6 mice infected with M1Δ511 (106 PFU by i.p. injection) harvested between days 44 and 50 postinfection. The data include three experiments which contained wt γHV68, M1.LacZ, and M1Δ511 with cells pooled from three to five mice per group per experiment, with additional data included from Fig. 8A.

References

    1. Ali A N, Turner P C, Brooks M A, Moyer R W. The SPI-1 gene of rabbitpox virus determines host range and is required for hemorrhagic pock formation. Virology. 1994;202:305–314. - PubMed
    1. Bosma M J. The scid mutation: occurrence and effect. Curr Top Microbiol Immunol. 1989;152:3–9. - PubMed
    1. Bowden R J, Simas J P, Davis A J, Efstathiou S. Murine gammaherpesvirus 68 encodes tRNA-like sequences which are expressed during latency. J Gen Virol. 1997;78:1675–1687. - PubMed
    1. Brooks M A, Ali A N, Turner P C, Moyer R W. A rabbitpox virus serpin gene controls host range by inhibiting apoptosis in restrictive cells. J Virol. 1995;69:7688–7698. - PMC - PubMed
    1. Cardin R D, Brooks J W, Sarawar S R, Doherty P C. Progressive loss of CD8+ T cell-mediated control of a gamma-herpesvirus in the absence of CD4+ T cells. J Exp Med. 1996;184:863–871. - PMC - PubMed

Publication types

Substances

LinkOut - more resources