Comparative Study
. 2000 Jan;10(1):116-28.

Bacterial artificial chromosome libraries for mouse sequencing and functional analysis

Affiliations
Comparative Study

Bacterial artificial chromosome libraries for mouse sequencing and functional analysis

K Osoegawa et al. Genome Res. 2000 Jan.

Abstract

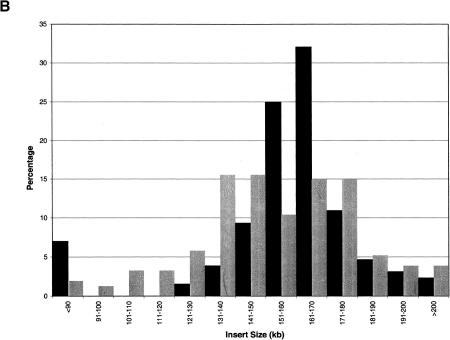
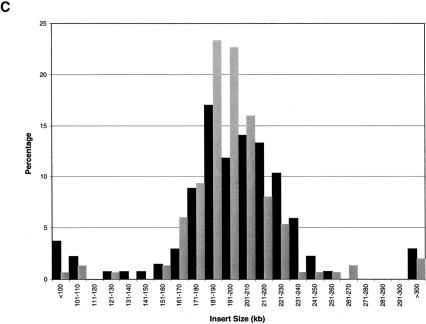
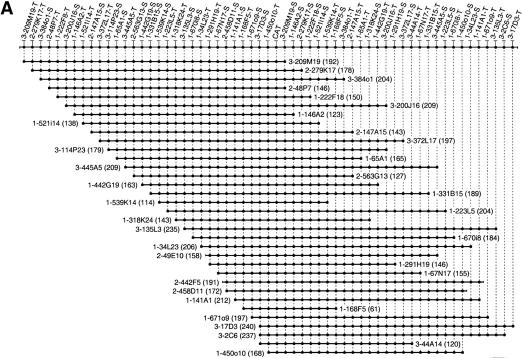
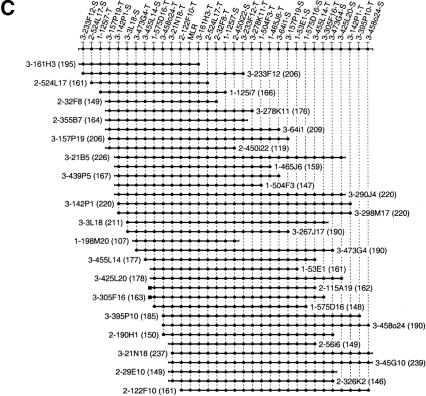
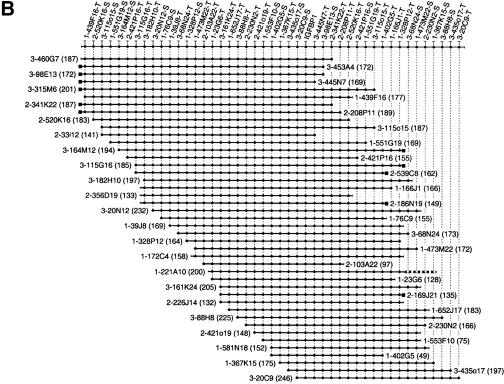
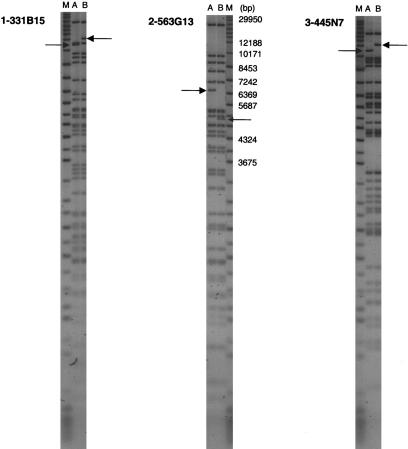
Bacterial artificial chromosome (BAC) and P1-derived artificial chromosome (PAC) libraries providing a combined 33-fold representation of the murine genome have been constructed using two different restriction enzymes for genomic digestion. A large-insert PAC library was prepared from the 129S6/SvEvTac strain in a bacterial/mammalian shuttle vector to facilitate functional gene studies. For genome mapping and sequencing, we prepared BAC libraries from the 129S6/SvEvTac and the C57BL/6J strains. The average insert sizes for the three libraries range between 130 kb and 200 kb. Based on the numbers of clones and the observed average insert sizes, we estimate each library to have slightly in excess of 10-fold genome representation. The average number of clones found after hybridization screening with 28 probes was in the range of 9-14 clones per marker. To explore the fidelity of the genomic representation in the three libraries, we analyzed three contigs, each established after screening with a single unique marker. New markers were established from the end sequences and screened against all the contig members to determine if any of the BACs and PACs are chimeric or rearranged. Only one chimeric clone and six potential deletions have been observed after extensive analysis of 113 PAC and BAC clones. Seventy-one of the 113 clones were conclusively nonchimeric because both end markers or sequences were mapped to the other confirmed contig members. We could not exclude chimerism for the remaining 41 clones because one or both of the insert termini did not contain unique sequence to design markers. The low rate of chimerism, approximately 1%, and the low level of detected rearrangements support the anticipated usefulness of the BAC libraries for genome research.


Figures

Figure 1
Figure 1
The insert size distributions of RPCI-21 (A), RPCI-22 (B), and RPCI-23 (C) libraries. A total of 434 clones from RPCI-21, 282 from RPCI-22, and 285 from RPCI-23 were selected randomly, taking separate ligations and transformations into consideration. The horizontal axis refers to the size range of insert DNA, and the vertical axis indicates the percentage of clones corresponding to each size range. Black bars and gray bars correspond to segment 1 and segment 2, respectively.
Figure 1
Figure 1
The insert size distributions of RPCI-21 (A), RPCI-22 (B), and RPCI-23 (C) libraries. A total of 434 clones from RPCI-21, 282 from RPCI-22, and 285 from RPCI-23 were selected randomly, taking separate ligations and transformations into consideration. The horizontal axis refers to the size range of insert DNA, and the vertical axis indicates the percentage of clones corresponding to each size range. Black bars and gray bars correspond to segment 1 and segment 2, respectively.
Figure 2
Figure 2
Fingerprinting and Southern hybridization have been applied to confirm positive clones and clone integrity. PAC and BAC DNAs from RPCI-21 and RPCI-23 clones from the CAT region were isolated and digested with EcoRI. The 1-kb ladder DNA marker was loaded on both sides of the gel.
Figure 3
Figure 3
Three 400-kb high-resolution end probe-based BAC–PAC contigs in murine CAT (A), IGFBP1 (B), and MLR (C) gene regions. The contigs have been assembled according to the hybridization results using SEGMAP contig assembly software. The deduced markers are depicted along the top and each short horizontal line with black circles represents PAC or BAC clones. The clone names are represented by the library name, plate number, and well position, e.g., 3-209M19 stands for RPCI-23 library, plate-209, M19 well. RPCI-21, RPCI-22, and RPCI-23 are shortened to 1, 2, and 3. The T7 and SP6 end markers are condensed as -T and -S after the clone name. The size of each clone is indicated in kb in parenthesis. Because the markers are spaced evenly in the contigs, the length of the horizontal line does not represent the clone size accurately. The dotted line in the IGFBP1 contig (B) indicates the partly chimeric clone 1-221A10. The black squares in B and C represent an identical clone end among neighboring clones. A unique marker was not designed from these ends because of the presence of repetitive sequence. However, these end sequences were used to ascertain additional 10 nonchimeric clones.
Figure 3
Figure 3
Three 400-kb high-resolution end probe-based BAC–PAC contigs in murine CAT (A), IGFBP1 (B), and MLR (C) gene regions. The contigs have been assembled according to the hybridization results using SEGMAP contig assembly software. The deduced markers are depicted along the top and each short horizontal line with black circles represents PAC or BAC clones. The clone names are represented by the library name, plate number, and well position, e.g., 3-209M19 stands for RPCI-23 library, plate-209, M19 well. RPCI-21, RPCI-22, and RPCI-23 are shortened to 1, 2, and 3. The T7 and SP6 end markers are condensed as -T and -S after the clone name. The size of each clone is indicated in kb in parenthesis. Because the markers are spaced evenly in the contigs, the length of the horizontal line does not represent the clone size accurately. The dotted line in the IGFBP1 contig (B) indicates the partly chimeric clone 1-221A10. The black squares in B and C represent an identical clone end among neighboring clones. A unique marker was not designed from these ends because of the presence of repetitive sequence. However, these end sequences were used to ascertain additional 10 nonchimeric clones.
Figure 4
Figure 4
The clone heterogeneity from fingerprinting gel images. (M) Marker, A and B are derived from different single colonies from the same clone. (center) Some sizes of marker bands are indicated. These fingerprints show a deletion that took place during replication. Arrows indicate inconsistent bands.

References

    1. Altschul SF, Gish W, Miller W, Myers EW, Lipman DJ. Basic local alignment search tool. J Mol Biol. 1990;215:403–410. - PubMed
    1. Chu G, Vollrath D, Davis RW. Separation of large DNA molecules by contour-clamped homogeneous electric field. Science. 1986;234:1582–1585. - PubMed
    1. Dunham I, Dewar K, Kim U-J, Ross MT. In: Genome analysis: A laboratory manual. Birren B, Green ED, Hieter P, Klapholz S, Myers RM, Riethman H, Roskams J, editors. Vol. 3. Cold Spring Harbor, NY: Cold Spring Harbor Laboratory Press; 1999. pp. 3–6.
    1. Frengen E, Weichenhan D, Zhao B, Osoegawa K, van Geel M, de Jong PJ. A modular positive selection bacterial artificial chromosome vector with multiple cloning sites. Genomics. 1999;58:250–253. - PubMed
    1. Green ED, Riethman HC, Dutchik JE, Olson MV. Detection and characterization of chimeric yeast artificial chromosome clones. Genomics. 1991;11:658–669. - PubMed

Publication types

Associated data

LinkOut - more resources