. 2000 Jan 24;148(2):283-92.
doi: 10.1083/jcb.148.2.283.

Promyelocytic leukemia (PML) nuclear bodies are protein structures that do not accumulate RNA

Affiliations

Promyelocytic leukemia (PML) nuclear bodies are protein structures that do not accumulate RNA

F M Boisvert et al. J Cell Biol. .

Abstract

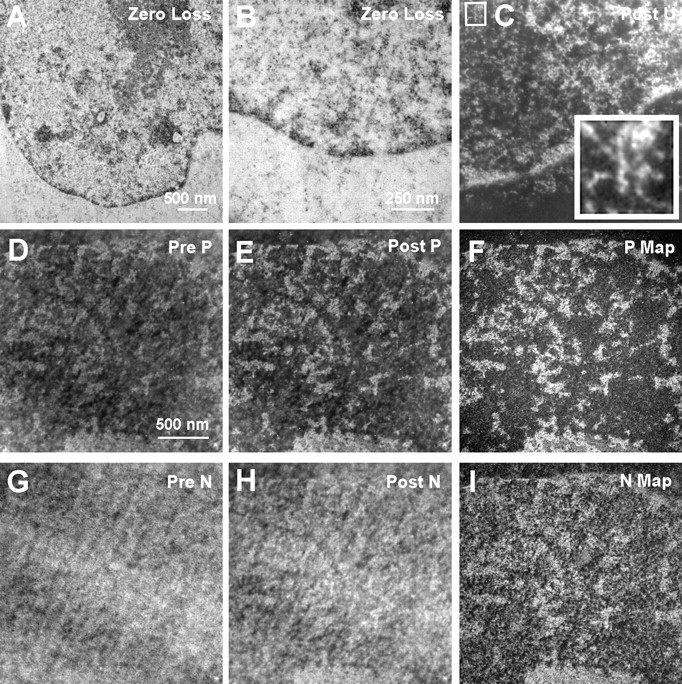
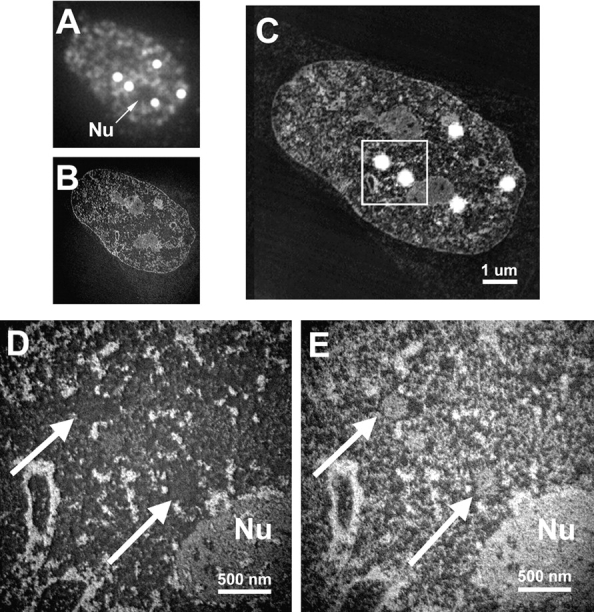
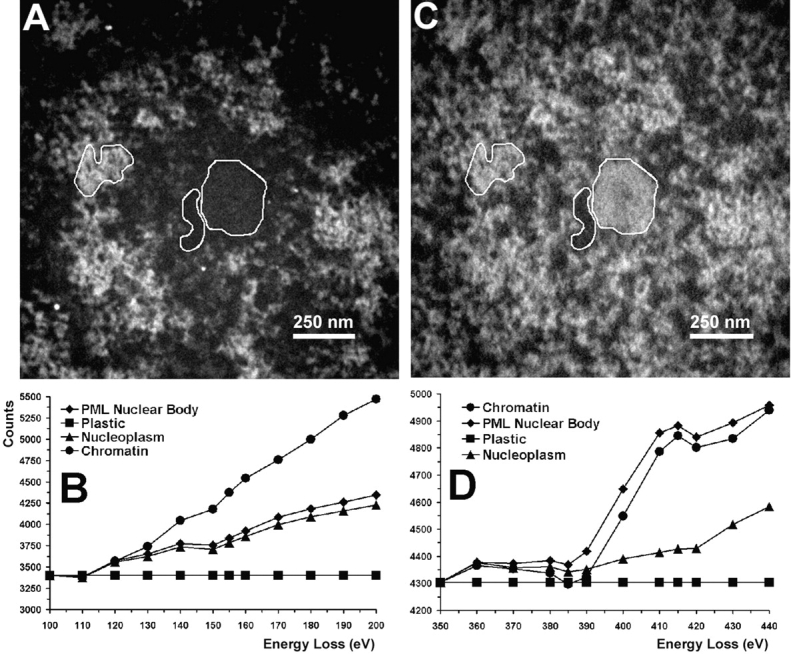
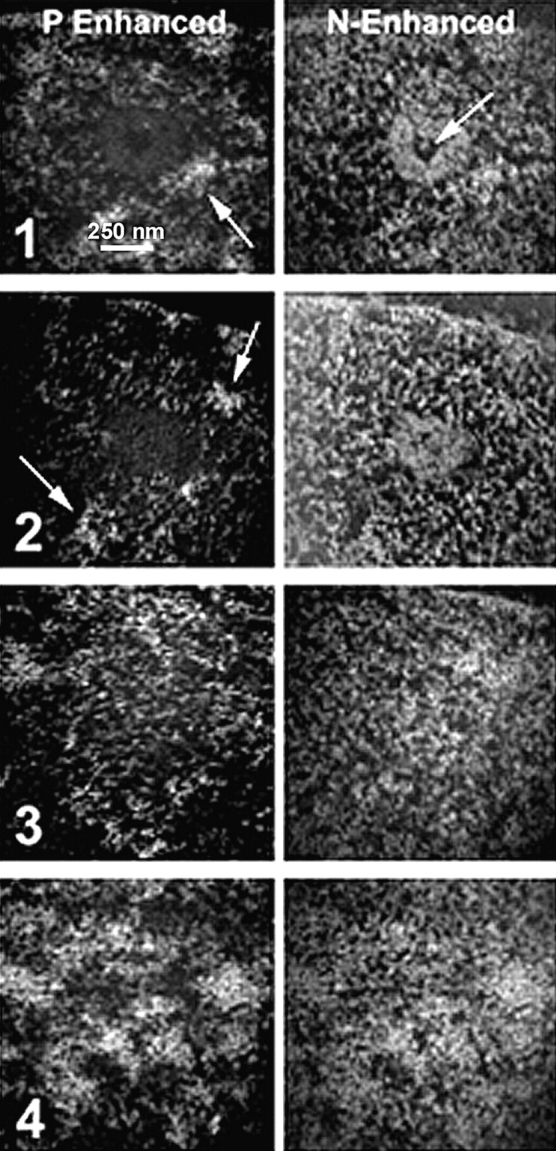
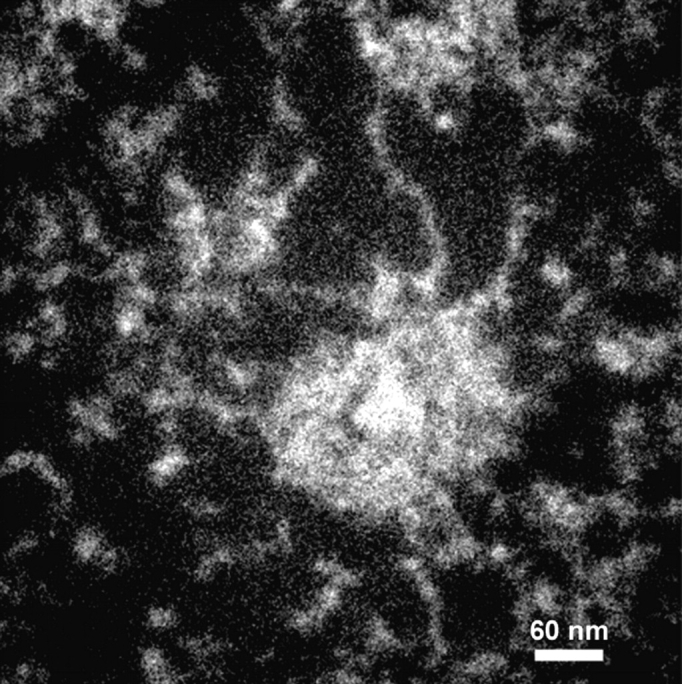
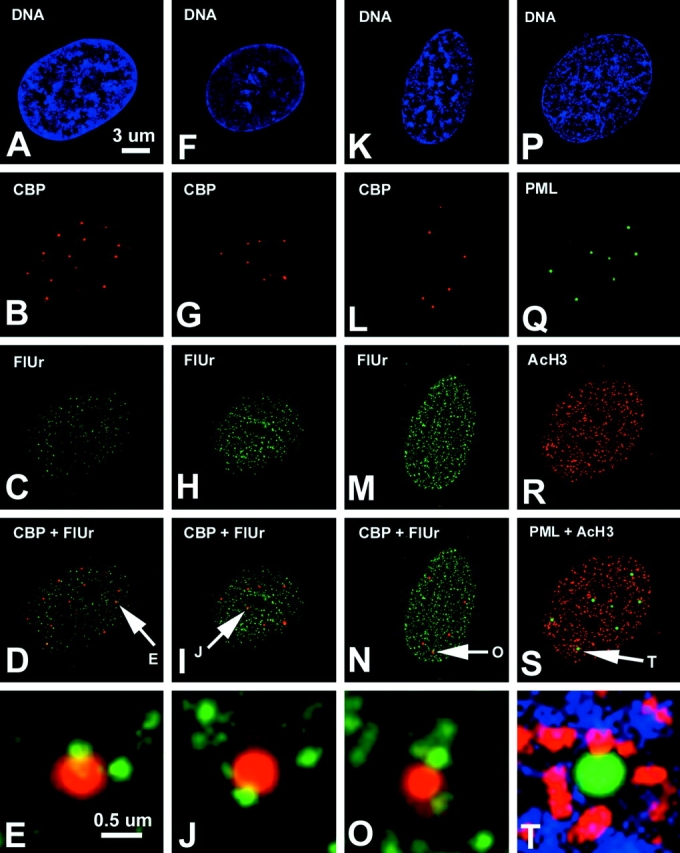
The promyelocytic leukemia (PML) nuclear body (also referred to as ND10, POD, and Kr body) is involved in oncogenesis and viral infection. This subnuclear domain has been reported to be rich in RNA and a site of nascent RNA synthesis, implicating its direct involvement in the regulation of gene expression. We used an analytical transmission electron microscopic method to determine the structure and composition of PML nuclear bodies and the surrounding nucleoplasm. Electron spectroscopic imaging (ESI) demonstrates that the core of the PML nuclear body is a dense, protein-based structure, 250 nm in diameter, which does not contain detectable nucleic acid. Although PML nuclear bodies contain neither chromatin nor nascent RNA, newly synthesized RNA is associated with the periphery of the PML nuclear body, and is found within the chromatin-depleted region of the nucleoplasm immediately surrounding the core of the PML nuclear body. We further show that the RNA does not accumulate in the protein core of the structure. Our results dismiss the hypothesis that the PML nuclear body is a site of transcription, but support the model in which the PML nuclear body may contribute to the formation of a favorable nuclear environment for the expression of specific genes.


Figures

Figure 1
Figure 1
Energy-filtered electron micrographs of a 90-nm section stained with uranyl acetate (A–C). Elastic images, collected at 0-eV energy loss (A and B), show chromatin and other structures as black on a grey background. An energy-loss image recorded at a uranium edge (120 eV; C) shows chromatin and other structures as white on a black background. The inset (4×) shows a 10-nm-diam chromatin fiber with periodicity (vertical fiber at center of inset). Fibers of <50% of this thickness are also prevalent in this section. An unstained section from the same block used in A–C was used to map phosphorus and nitrogen. A phosphorus reference image (120 eV; D), a phosphorus-enhanced image (155eV; E), and a phosphorus map (F) are shown. Nitrogen reference (385 eV), enhanced (415 eV), and map are shown (G–I, respectively).
Figure 2
Figure 2
Correlative microscopy. Cells were labeled with anti–CBP-NT antibody, embedded, and sectioned. Sections are first imaged by immunofluorescence microscopy (A), followed by EM using ESI (B). The images are resized and rotated for proper alignment before being merged (C). Structures are represented as white objects on a black background. Immunofluorescence microscopy also serves to identify and locate structures of interest, so that these can be analyzed at the ultrastructural level by ESI, to map phosphorus (D) and nitrogen (E). The region indicated by the box in C is magnified in D and E. Nu, Nucleolus; arrows, the two PML nuclear bodies from C.
Figure 3
Figure 3
Quantification of phosphorus and nitrogen content of a PML nuclear body at high magnification. The three indicated areas were used for quantification of phosphorus and nitrogen. The left region corresponds to chromatin, the middle region to nucleoplasm, and the right region to the core of a PML nuclear body. A fourth region (not shown) corresponds to a region outside the cell, containing only the embedding resin. The signal over the resin was used to normalize all images and was adjusted to the same value for each image. Therefore, these represent background-stripped spectra on the basis of this normalization. The phosphorus map is shown in A and the nitrogen map in C. Energy-loss spectra of these regions spanning the phosphorus L2,3 edge (B) and the nitrogen K edge (D) are presented at 10-eV intervals. Structures are represented as white objects on a black background.
Figure 4
Figure 4
Serial sections of 90-nm thickness of a PML nuclear body stained with uranyl acetate. Images in the left column are phosphorus-enhanced, recorded at 155 eV, and those in the right column are nitrogen-enhanced, recorded at 415 eV. The middle of the PML nuclear body is shown in section 1. The protein core is visible in the nitrogen-enhanced image, and a hole on the core is indicated with the arrow in the nitrogen-enhanced image. Arrows in the phosphorus-enhanced images indicate blocks of condensed chromatin. Structures are represented as white objects on a black background. The next section (2) still shows the protein core, whereas section 3 is now out of the core of the nuclear body. The last section (4) shows the chromatin closing back over the structure.
Figure 5
Figure 5
Thick section of a PML nuclear body, stained with uranyl acetate, recorded at 415 eV. Extended fibers are observed just outside the core of the PML nuclear body. Structures are represented as white objects on a black background. These fibers are ∼2–4 nm in diameter, and are also phosphorus-rich (not shown).
Figure 6
Figure 6
Digital deconvolution microscopy of SK-N cells pulsed with FU for 2 (A–E), 10 (F–J), or 60 (K–O) min. FU was labeled with an anti-BrdU antibody (green, C, H, and M) and anti–CBP-NT antibody (red, B, G, and L). Merged images are shown in D, I, and N, and a high magnification of one PML nuclear body for each time course is displayed in E, J, and O. DNA stained with DAPI shows the nucleus of each cell (A, F, K, and P). Some cells were labeled with an antibody against the highest acetylated form of histone H3 (green, R) to reveal transcriptionally active/competent chromatin. PML nuclear bodies were detected with an antibody against PML protein (5E10) shown in Q. Images Q and R are merged to form S, and the indicated PML nuclear body is magnified in T.

References

    1. Ascoli C.A., Maul G.G. Identification of a novel nuclear domain. J. Cell Biol. 1991;112:785–795 . - PMC - PubMed
    1. Bazett-Jones D.P., Hendzel M.J. Electron spectroscopic imaging of chromatin. Companion Meth. Enzymol. 1999;17:188–200 . - PubMed
    1. Bazett-Jones D.P., Hendzel M.J., Kruhlak M.J. Stoichiometric analysis of protein- and nucleic acid-based structures in the cell nucleus. Micron. 1999;30:151–157 . - PubMed
    1. Bernhard W. A new staining procedure for electron microscopical cytology. J. Ultrastruct. Res. 1969;27:250–265 . - PubMed
    1. Boggs B.A., Connors B., Sobel R.E., Chinaud A.C., Allis C.D. Reduced levels of histone H3 acetylation on the inactive X chromosomes as shown by histone acetylation. Chromosoma. 1996;105:41–49 . - PubMed

Publication types

MeSH terms